
Rain, sleet, snow, and fog complicate highway transportation, making driving conditions hazardous and often causing worse-than-normal congestion.
Drivers should use extreme caution and slow their speed when the road is wet or icy. Avoid any sudden changes in direction when conditions are poor. If you see a slippery when wet road sign during poor driving conditions, start slowing down.
Rain and Flooding
Rain causes wet pavement, which reduces vehicle traction and maneuverability. Heavy rain also reduces visibility distance. Rain and wet pavement increase crash risk as well.
Most weather-related crashes occur on wet pavement and during rainfall.
- Each year, 75 percent of weather-related vehicle crashes occur on wet pavement and 47 percent happen during rainfall.
- Nearly 5,700 people are killed and more than 544,700 people are injured in crashes on wet pavement annually.
- Every year, over 3,400 people are killed and over 357,300 people are injured in crashes during rainfall.
A critical factor affecting an operator’s capability is perception-reaction time:
Perception is the individual’s recognition of a hazard, or the need to react. Reaction is the individual’s ability to respond to avoid the hazard.
Perception-reaction time can determine whether a crash will occur, or not. The shorter the perception-reaction time, the sooner the operator provides input to the vehicle and starts maneuvering to avoid the hazard.
The vehicle continues moving at the same speed toward the hazard during the time it takes the driver to perceive and react. Perception-reaction time becomes critical as speed increases. At slower speeds, the vehicle does not travel much distance during the time it takes the driver to react.
At higher speeds, the vehicle will travel more distance during the same time interval placing it closer to the hazard before the driver starts providing the necessary inputs. Therefore, even fractions of a second are important.
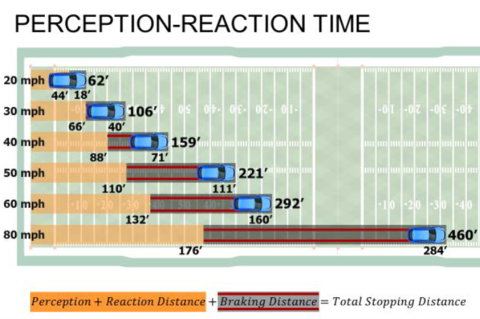
Vehicles moving at higher speeds have more momentum than vehicles at lower speeds. More braking force must be applied to vehicles traveling at high speeds:
• At 20 mph, the average vehicle will travel an additional 18 feet after the brakes are applied for a total stopping distance of 62 feet
• At 50 mph, the vehicle will travel an additional 111 feet for a total stopping distance of 221 feet
• At 80 mph, the vehicle will travel an additional 284 feet for a total stopping distance of 460 feet
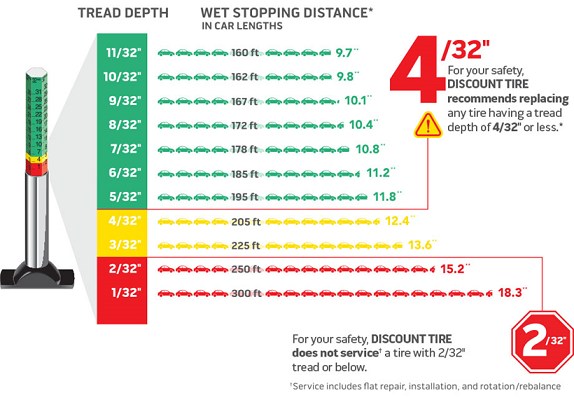
When your tires are in contact with the road, they create friction which directly affects the handling and stopping capabilities of your vehicle. The amount of friction created can vary between different types of roads, weather conditions and the amount of tread remaining on your tires.
Most passenger car tires begin with 9 or 10/32nds of usable tread; light truck tires and winter tires may have more. The amount of tread is especially important on wet roads, as the tread grooves help your tires displace water to stay in contact with the road. You can see how tread wear impacts stopping distance illustrated below.
Hazards that can be avoided at low speeds may be unavoidable at higher speeds.
Human reaction time does not change for higher speeds. Higher speed increases crash severity. When the driver’s capability is overwhelmed by higher speeds, the chances of a collision are increased. The higher speed also increases the chances of death or serious injury.
The extent of crash damage depends upon the amount of energy present. The faster a vehicle is moving, the more kinetic energy it takes into a crash. The amount of kinetic energy increases greatly with only slight increases in speed. As the amount of energy increases, the chances of a fatality increase. A collision at 60 mph is 50 percent more likely to result in a fatality than one at 45 mph. A collision at 70 mph is four times more likely to result in a fatality than a crash at 45 mph.
Sources: https://www.nhtsa.gov/sites/nhtsa.gov/files/documents/core_participant_manual-smd-2018.pdf.; https://highways.dot.gov/public-roads/novemberdecember-2004/another-rain-delay ; https://www.discounttire.com/learn/stopping-distance