You are likely to be many, many discussions about income inequality, redistribution, and the state of the “middle class” in the coming months. There was all sorts of hubbub last week when presidential candidate Mitt Romney said that families making between $200,00 and $250,000 were part of the middle class.
Could Romney be correct?
Off the top of my head, I really don’t know whether that is true or not.
There are different ways to break down income, but some of the standard are by individual, family, and household. If you take a look at the median (middle) value, the median individual income is about $26,500 and the average income is closer to $40,000. The average is greater than the median because people with high salaries drag the distribution out to the right.
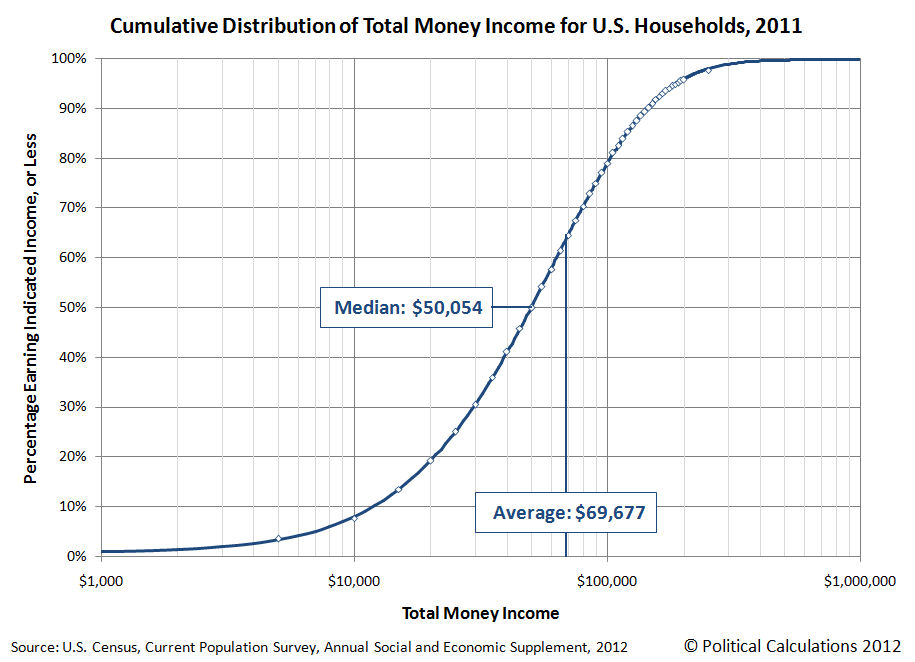
At the household level, the median household is about $50,000 per year, again indicating that half of all households make more and half less than that. So Romney’s definition of middle class includes people making four to five times as much as the median family.
This gives us some perspective on things, but taking a look at central tendencies — medians and averages — only gets you so far.
So, fortunately for us, the good people at the Political Calculations blog have given us a web tool to see exactly who stands where. Taking a look at household incomes on the right, we can get a very good idea where the “middle class” is. For example, if we define the middle class as the 20th to 80th percentile households, then the middle-class income is in the $20,700 to $102,500 range. You can pull this figure for yourself from the graph to your right. Start at 20% and follow it across to the distribution, and then go down to see the total money income.
As you probably know, $200,000 is a fair bit of money. A household with that level of income is in the 96th percentile, not quite high enough to qualify for the top 1% and the scorn and indignation of the Occupy movement, but still a good living. Incidentally, it requires $305,000 to get into the top 1% if that’s of interest to you.
Be sure to write when you get there.
The little tool will be very helpful as we march toward the election, but it will also help us to frame where we put our sympathies (if anywhere) in any number of labor disputes. For example, here’s Tuesday Morning Quarterback Gregg Easterbrook on some labor disputes affecting professional sports:
The NFL Referees Association is angry about an NFL offer that would raise officiating salaries to an average of $189,000 annually for part-time work. The NHL union is angry about an offer that would reduce the current player average of $2.4 million to a mere $2 million annually.
Yes, many NFL and NHL owners are ogres, and none should receive public subsidies. But the framing of the disputes — unions claiming to be working-class victims versus plutocrats — is 50 years out of date. A hobby that pays $189,000 a year; a child’s game that pays $2 million a year plus leads to celebrity. The people offered these deals are angry and feel ill-used?
You can see where Easterbrook comes down here, and plugging the$189,000 into our tool shows that the NFL referee will be making more money than 98.7% of all individuals and 95% of all households nationally. My son also runs around in his pajamas blowing a whistle on Sundays, but he is not compensated quite so handsomely.
Of course, athletes aren’t the only ones with a beef. Chicago public school teachers have been on strike for more than a week now, probably more over evaluation than over pay, but their salaries seem to stack up pretty favorably with their peers across the country. Here are some of the parameters of the contract under negotiation:
In Chicago, the starting salary is roughly $49,000, and average salary is around $76,000 a year.The tentative contract calls for a 3 percent raise in its first year and 2 percent for two years after that, along with increases for experienced teachers. While many teachers are upset it did not restore a 4 percent pay raise Emanuel rescinded earlier this year, the contract if adopted would keep Chicago teachers among the highest-paid in the country.
The average salary puts the teacher in the 68th percentile, and two “average” teachers earning $152,000 per year would be in the top 10% of all households nationally.
Closer to home, our own Lawrence website boasts that “Lawrence grads earn the highest mid-career salary of any Wisconsin college,” with median starting salaries of $39,700 and mid-career salaries of $89,700. The starting salary puts our median graduate ahead of two-thirds of the population and ahead of 40% of all households.
Might be useful to share with your faculty colleagues too, who mostly (at least at my institution) seem to think they are lower-middle class. It’s harder to rail against the top 10% after you realize you are part of it.