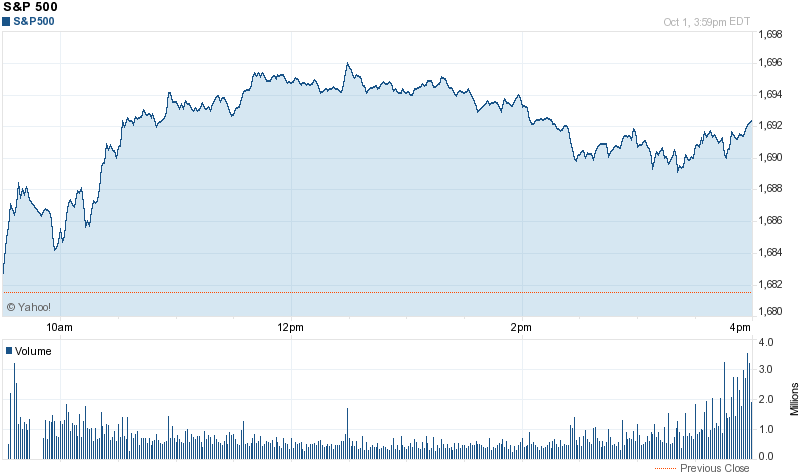
The chart shows today’s S&P 500 trajectory on the heels of the epic government shutdown. I’m sure there’s a lesson in here somewhere:
Tag: Fiscal Policy
Mental or Fiscal Cliff?
Those of you who occasionally turn on the news might have heard that U.S. policy is headed toward a “fiscal cliff” if Congress and President Obama fail to reach an alternate budget agreement. For those of you who have been hiding under a cliff since the election, the “fiscal cliff” is simply a set of policies, both tax increases and budgetary cuts, that are probably more severe than most politicians are willing to take the blame for, and could possibly lead to a double-dip recession. The situation is so severe that The Washington Post has set up an entire Fiscal Cliff Blog dedicated to the matter.
It seems most economists and policy analysts who blog have weighed in on the issue one way or another. I recommend economist Ed Dolan’s blog, which points us to a reasonably cool background video by Lee Arnold. Arnold doesn’t seem to mention that the Congressional Budget Office projections assume that we go over the fiscal cliff and there are reasonably steep tax increases. If you watch the video, be sure to check out Dolan’s commentary to put things in perspective. Dolan also has a nice discussion of what “sustainable” fiscal policy looks like that is cross-posted at the EconoMonitor.
But, writing over at the Cheap Talk blog, Northwestern economist Sandeep Baglia says it won’t happen because the Obama Administration will cave. Why? Because a fiscal contraction of this magnitude is likely to be significant enough to push the economy back into a recession, and the Administration politically can’t afford another downturn if it wants to do some of the other things that it probably wants to do.
Or probably won’t happen, at least.
UPDATE: As you knew he would, the indefatigable Ironman at the Political Calculations blog provides a calculator so you can see the effects on you for yourself.
Kotlikoff puts the “scare” in “scaricity”
The Globe and Mail has a piece onLaurence Kolikoff’s assessment of the U.S. fiscal situation, and it’s not pretty. The official estimate is that government debt is about 60% of GDP ($13.5-trillion). Kotlikoff says “Let’s get real,” and puts the figure at more like $200 trillion.
For those of you that want to go straight to the source, Kotlikoff lays out his case in the IMF publication, Finance & Development.
No Laffing Matter
If a firm wants to increase its revenues, should it raise its prices? The answer, of course, depends on the elasticity of demand for its product. If consumers are very responsive to price changes, a price increase could lead to lower revenues. Ack!
Now, if a government wants to increase it revenues, should it raise or lower tax rates? In this case, the answer depends on (among other things) how sensitive workers are to marginal tax rates. Arthur Laffer famously pointed out that it’s possible that taxes are so high that reducing them could induce people to work so much that lower tax rates could increase tax revenue.
The Laffer Curve rests on a simple conjecture — if tax rates are zero, then no tax revenue is generated. Well, that’s not a conjecture, that’s true. The conjecture is that if tax rates are 100%, then no one would bother to work because all wages would be absorbed into the government coffers. Because nobody would work, tax revenue would be zero.
Hence, we know two points of the Laffer curve — at tax rates of 0 and 100%. A key empirical question, then, is where does the Laffer Curve bend? The figure shows tax rates increasing along the horizontal axis leading to various levels of tax revenues on the vertical axis. The nice stylized version is symmetric with a nice revenue-maximizing peak, but there is no reason to believe the curve is symmetric (or even single peaked, really… at least I don’t think so). However, it is critical to know what the curve looks like so as to understand the likely implications of a tax increase or decrease. If we are to the right of C, an increase in tax rates will actually reduce tax revenues. Ack!
So where does it bend? The ever-energetic Ezra Klein surveys some of the giants of economics and policy folks in the know (the policy folks are mostly right of center) to get some answers. For those who are willing to proffer a number, that number is generally much higher than our highest marginal tax bracket. Tax guru Joel Slemrod, for example, is thinking its north of 60%.
Here are a couple of pithy responses:
Greg Mankiw: My guess is that that the short-run answer and the long-run answer are quite different. For example, if you raised the top rate from 35 to, say, 60 percent, you might raise revenue in the short run. Over time, however, you would get lower economic growth, so the additional revenues would fall off and eventually decline below what they would have been at the lower rate…. I will pass on offering a specific number, as it would require more time and thought than I can offer just now, but I will opine that I think the long-run answer is actually more important for policy purposes than the short-run answer.
Martin Feldstein: Why look for the rate that maximizes revenue? As the tax rate rises, the “deadweight loss” (real loss to the economy rises) so as the rate gets close to maximizing revenue the loss to the economy exceeds the gain in revenue…. I dislike budget deficits as much as anyone else. But would I really want to give up say $1 billion of GDP in order to reduce the deficit by $100 million? No. National income is a goal in itself. That is what drives consumption and our standard of living.
Short run, long run, deadweight losses.
Good stuff!
