In a post two days ago, I highlighted the CBO report on the change in income inequality in the United States between 1979 and 2007. The last sentence of that blogposting opines that the households represented in each quintile change over time; therefore, it’s not necessarily those who were in the top 1% in 1979 who made the massive gains in share of income and remained in the top 1% in 2007.
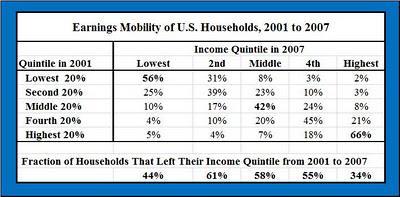
A recent Federal Reserve Bank of Minneapolis report highlights the dynamics of household movement across income quintiles during the 2001 to 2007 period. The chart below shows that 44% of those in the bottom bracket in 2001 escaped to higher brackets by 2007 and that 34% of those in the highest quintile fell to at least the second quintile. Longitudinal studies of particular households are most useful if we wish to understand what has happened to the distribution of household incomes over time. The CBO study does not address the question, but the Panel Study of Income Dynamics selects a relative short and volatile period for its reference points.
 How does this all matter? It matters in that policy makers respond to such information to reshape both the regulatory structure and income tax policies. Given budgetary impasses that have characterized the past year, our legislators have not been able to reach any sort of consensus on how to do three things 1) ensure that the tax system creates appropriate incentives for generating growth, 2) put the US budgetary future on a sustainable path, and 3) create an efficient and equitable tax structure. Will we again fail to take the opportunity to reach such desiderata? What do you think?