deathriskrankings.com

Tag: deathriskrankings.com

Semi-Annual Daylight Savings Post

Those of you who follow this blog have probably noticed that I (a) study mortality risks, and (b) that I have something to say about how those mortality risks change when the clocks spring forward and fall backward.   This fall is no exception, as I am quoted in a blurb on the Time magazine blog about how things are about to get more dangerous late in the day as a result of the time change.

Behold!:   The break in the series starting in month 11:

The Appleton Day


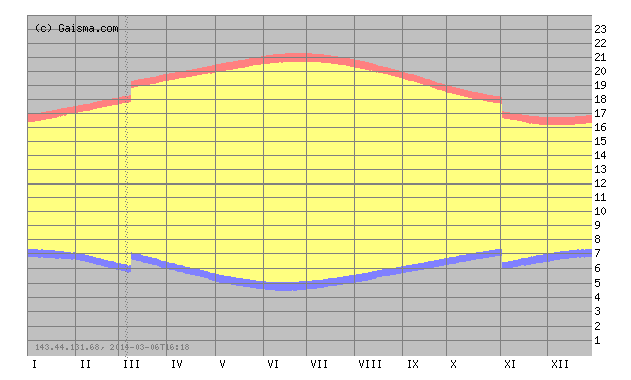
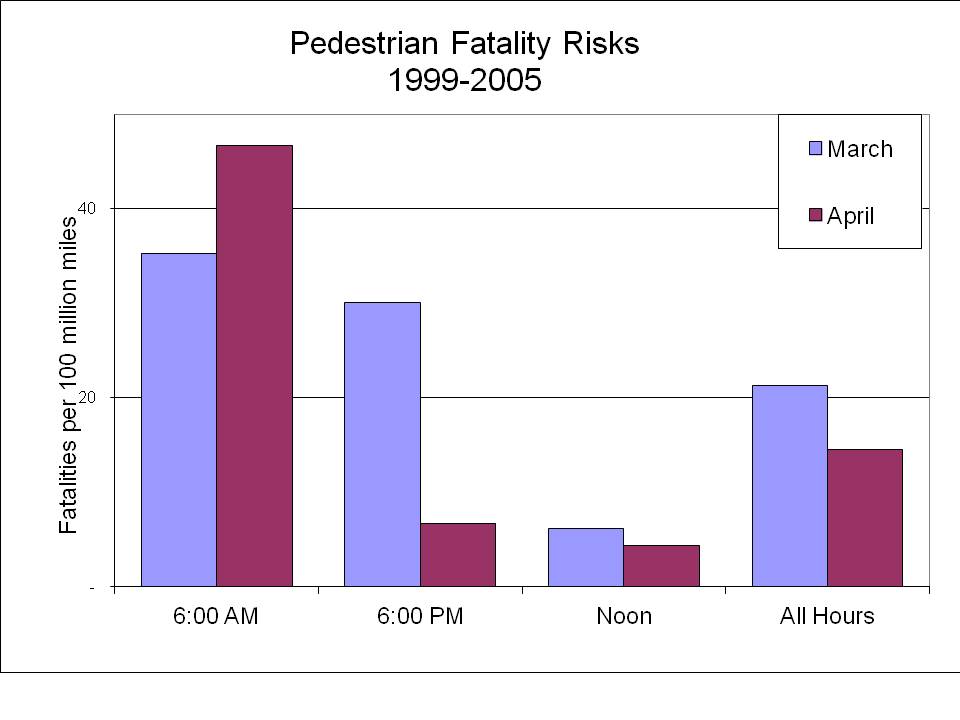
That’s daylight for Appleton, Wisconsin, from the remarkable Gaisma.com site.  Starting Sunday it is going to be dark at 5 p.m.  meaning that you are far more likely to get hit by a car at 5 p.m. next week than you are this week.   When I say “far more likely,” our estimate is that the risk is about three times as high!

Of course, you are also far less likely to get hit at 6 a.m. in the extremely unlikely event that you are out 6 a.m.  But, notice, but January 1 the sun won’t rise until after 7 a.m., and if DST was permanent, that would be 8 a.m.   Sunlight is the ultimate scarce resource.

Here is our previous coverage.


Is that Love in the Air?

Back in 2003, the combination of heat and bad air quality in Paris got so bad that it claimed the lives of an estimated 10,000 people.

That was one nasty wave of heat and pollution.

It seems that something other than love is in the air once again, and things have gotten so bad that Paris officials banned all cars with even numbered license plates this past Monday.  The reason is the shockingly high levels of particulate matter concentration (PM).  PM is a “criteria” pollutant regulated by the EPA, and it is linked to possibly several hundred thousand premature deaths each year.  In the US, however, the dominant source of emissions is coal-fired power plants, whereas the EU has a much bigger share of its passenger vehicles powered by diesel fuel.  These diesel vehicles are much greater contributor to PM than the gasoline-powered vehicles common in the US.

From the AP story:

The safe limit for PM10 is set at 80 microgrammes per cubic metre (mcg/m3). At its peak last week, Paris hit a high of 180 mcg/m3 but this had fallen to 75 mcg/m3 by Monday.

I suppose the fact that it fell to 75 mcg/m3 is comforting, but that is still very high.  As a basis for comparison, I picked a monitoring station from Los Angeles –one of the heaviest polluted urban areas in the US.  The data are available at the EPA air trends site, which tracks every monitoring station.

LA PM

Notice that the standard is the second-highest average for a 24-hour period, with the U.S. standard at 150.  Also notice that the 75 mg/m3 that Paris returned to is still about as bad as it gets down in LA these days.

More Light?!?

I am one of the contributors to the New York Times Room for Debate section today on Daylight Saving Time.  My contribution has to do with the changes in pedestrian fatality risks and total fatalities associated with the time change. (UPDATE:  There is also a piece up in the Sunday Appleton Post-Crescent).

So, what does a time change look like?  Glad you asked:  The figure from the sunshine authority, Gaisma.com, shows daylight patterns for our own Appleton, Wisconsin.  Each day starts with midnight at the bottom and goes to the top, and the months go left to right.  The blue line is the dawn and the red the dusk.

The Appleton Day
Appleton Time

The switch to DST in March and the switch back to standard time in November are clear — they are the discontinuities (the “breaks”) in the sunrise and sunset curves.  Because we “spring ahead” one hour, the sunrise time on Sunday morning will be one hour later than it was on Saturday.  An early morning walk that was in that daylight on Saturday will be in the dark on Sunday.  To have a sunrise at the same time as Saturday’s, we will have to wait until early April.  The opposite happens in the evening.  Sunset will be one hour later starting on Sunday.  There will be less light in the morning, but more light in the evening.

Light and visibility are extremely important determinants of traffic safety, particularly for pedestrians.  Paul Fischbeck and I looked at data from 1999-2005 on fatalities and travel patterns, and determined that the morning risk increases about 30% per mile walked, while the afternoon risk falls close to 80%.

The figure below shows pedestrian fatality risks from 1999-2005.  The blue and maroon bars show fatality risks per 100 million miles walked in March and April, respectively.  Note that for the 6 a.m. time slot the risks increase about 30%, whereas for the 6 p.m. time slot the risks take a sharp nosedive.  At midday the risks stay right about the same (we found no statistically significant difference in risks for that time period).  Overall, total pedestrian fatalities decrease in the Spring both because risks fall more in the evening than they rise in the morning, and there are many more people out later in the day.

Ped Spring

These data are rather crude in the presentation, as they do not focus specifically on the days leading up to and immediately following the time shifts, which is how researchers typically isolate the effects of the time change.

Here are some references for those interested:

S A Ferguson, D F Preusser, A K Lund, P L Zador, and R G Ulmer “Daylight saving time and motor vehicle crashes: the reduction in pedestrian and vehicle occupant fatalities,” American Journal of Public Health 1995 85:1, 92-95

J M Sullivan and M J Flannagan, “The role of ambient light level in fatal crashes: inferences from daylight saving time transitions,” Accident Analysis & Prevention, 2002 34:4, 487-498

D Coate and S Markowitz, “The effects of daylight and daylight saving time on US pedestrian fatalities and motor vehicle occupant fatalities,” Accident Analysis & Prevention, 2004, 36: 3 351-357


The Price of Life

In this, the 500th post on the Lawrence Economics Blog, we bring you a story from the NYT on the statistical value of life.  Indeed, as anyone in an environmental economics or policy course knows, the “value” placed on saving a statistical life (VSL) is associated with reductions in risk levels that decrease the probability of being killed (i.e., from reducing the number of purple balls in your urn).

This VSL is pivotal in determining the benefits of many non-economic regulations, and many federal agencies have increased the value used in benefit assessment in the past few years.

The Environmental Protection Agency set the value of a life at $9.1 million last year in proposing tighter restrictions on air pollution. The agency used numbers as low as $6.8 million during the George W. Bush administration.

The Food and Drug Administration declared that life was worth $7.9 million last year, up from $5 million in 2008, in proposing warning labels on cigarette packages featuring images of cancer victims.

The Transportation Department has used values of around $6 million to justify recent decisions to impose regulations that the Bush administration had rejected as too expensive, like requiring stronger roofs on cars.

That is the salient point of the article; the rest mostly gets down to talking about the prospects and problems of using VSLs in the first place.  If you are reading this, you probably know already.

Are you feeling lucky, Prius?

My colleague Paul Fischbeck is in the news for calculating the incremental risks from driving a Toyota with an accelerator problem.  According to his press release:

In the U.S., there is a little more than one fatality for every 100 million miles driven. The average U.S. vehicle logs about 13,000 miles each year. Based on these averages, for the 2.3 million Toyotas being recalled, there are about 340 fatalities every year for causes unrelated to the accelerator. The accelerator problem is adding about six deaths every year to this total — meaning that the accelerator problem is increasing the driving risk by about 2 percent.

So there’s a meat-and-taters public policy question for you — do the benefits of fixing the problem justify the costs of a massive recall?   To put this in context, a 2 in a million chance is about the same as flipping a coin 19 times and getting heads every time.

See you in 240.