In Case You Were Wondering

Category: In Case You Were Wondering

Better Late than Never, I Say

But why are economists, once thought to be humorless practitioners of the “dismal science” suddenly becoming celebrities? Since when did they become gurus to whom ordinary people can turn to for everyday-life advice?

That’s from “Rise of the Celebrity Economist,” at Salon.com.

If you have to ask why, then my guess is that you aren’t going to get a very flattering portrait.

The Chicken Dance is a Grim Trigger

The Sheboygan Press reports on a recent showdown at the Sheboygan North High School Homecoming dance.  It seems the jubilant student dancers broke out some moves that strayed a bit too far to the salacious side, prompting Principal Jason “Takes No” Bull to issue this dictum:

[Bull announced] that if inappropriate behavior were to continue, the lights would stay on, the chicken dance song would be played for the rest of the night, and/or the dance would be canceled.

The grim trigger is a strategy in a non-cooperative game, where one party threatens to end cooperation forever if the other party fails to cooperate.  Evidently, it was a credible threat.

Perhaps this helps to explain why.

Let Me Guess — Your PIN is 1234, right?

As easy as 1234… Or 2580!

If a random sample of the population is reading this post, then more than 10% of you are saying “why, yes. Yes it is!”

What about the other 90% of you?  Hmmm, let me see here — How about 1111? 0000? 1212? 7777?

Those next four numbers should account for another 10% of you, so those five account for one in every five (20%) of all four-digit passwords. That is, the numbers that protect your savings and checking accounts, among other things, from would-be interlopers.

Jeepers.

It turns out that only 426 codes account for more than half of all passwords. If passwords were distributed randomly, it would take 5,000, of course. So someone who nicks your debit card has a pretty good chance of cracking your code just by going through a list of “easy to remember” numbers.

How do I know all of this?

The crew over at the Data Genetics blog got a hold of 3.4 million passwords from breached databases, and took a look at the frequency of various numbers in a mind-boggling array of ways. Very cool post.  And, for most of you, probably time to change your password.

For those 0.000744% of you with 8068 — the least common password — it’s probably time to change your password, too.  Once people see that it is the least common, they will pick it and it wont be least common any more. Oh, 2727.

2580 comes in at #22.  Can you see why?

Riesgo Moral

In our continuing series on how incentives shape behavior, we take a look across the sea to España, where a man tragically sawed off his arm to collect on eight insurance policies.  It seems that insurance fraud is on the rise in the depressed economies of Europe

According to data from the ICEA, which carries out research for insurance and pension providers, there were 54,114 fraudulent claims in 2003; in 2011, there were 130,959.

We, of course, have seen this sort of thing before.  And even before that.

But it turns out that it is not only the depressed economies of Europe that are seeing a rise in fraud.  Right here in the U.S. it appears that there is a rather substantial rise in Social Security Disability Insurance claims.  I had first heard about this on an EconTalk episode featuring David Autor.

Craig “Ironman” Eyermann at the Political Calculations blog has the numbers here and further elaboration here.


Well, Just Wait Until the Winter Games

Some of you are aware that the summer Olympics have been taking place over the past few weeks, with athletes all around the world convening in London to kick each other, swim and dive in perfect synchronicity, throw balls into nets, and perform other feats of strength. As a way of monitoring each country’s progress, it is customary for the IOC and the media to keep a tally of how many medals each country has accumulated and then talking about it as if it had some great import. This year the United States amassed a whopping 104 total medals, with the People’s Republic of China coming in a distant second with 88 and Great Britain with a mere 65.

That metric never seemed quite right to me, though, because many events seem kind of like made up sports, and others involve teams, yet the team victory seems to just count as one medal.

Those issues aside, there is also the more fundamental issue that a country like, say, Grenada doesn’t have very many people in it.  Indeed, it might be the case that the Chinese sent more athletes to London than the entire population of Grenada combined. Yet, Grenada and China are set on equal footing in the ubiquitous Medal Count competition.

That’s why we’re fortunate to have Medals Per Capita dot Com keeping it real for us. The site does what you’d expect, adjusting the medals count based on population to produce the coveted “population per medals” metric.

And, on that score, the rankings change dramatically.  Indeed, tiny Grenada, with only 110,821 people, leads the way with one medal and a population per medal score of 110,821.   This bests second-place Jamacia’s score of 225,485 by a lot.  But Jamacia did come in with an astonishing 12 medals despite having a population slightly larger than the Pittsburgh metro area. Trinidad and Tobago and the Bahamas are also among the top five.

I should also mention — before somebody does it for me — that Hungary is an impressive 8th with 17 medals for a population of 10 million, which is about one medal per 600,000 inhabitants.

What about the “medals count winners”?  Well, the mighty US with its 104 medals is only about one medal per three million people, good for a measly 49th place, while China is way down in 74th on a per capita basis, with only a medal per 15 million people.

So, to put things in perspective, a simple linear extrapolation suggests that if Grenada had China’s population, it would have amassed more than 12,000 medals. In contrast, with 84 medals per 1.3 billion people, if China had Grenada’s population, it would have netted only 0.0068 medals.

On the one hand, this illustrates why it is probably a good idea not to put too much stock in linear extrapolations, but on the other hand, these types of comparisons are important, as any sort of comparative analysis needs to have some reasonable baseline or measure of perspective.

The Medals per Capita dot Com page has a whole menu of metrics for you to play with, so with the fall term at least a week away, go ahead and start playing.

Lawrence Students v. Card-Carrying Economists

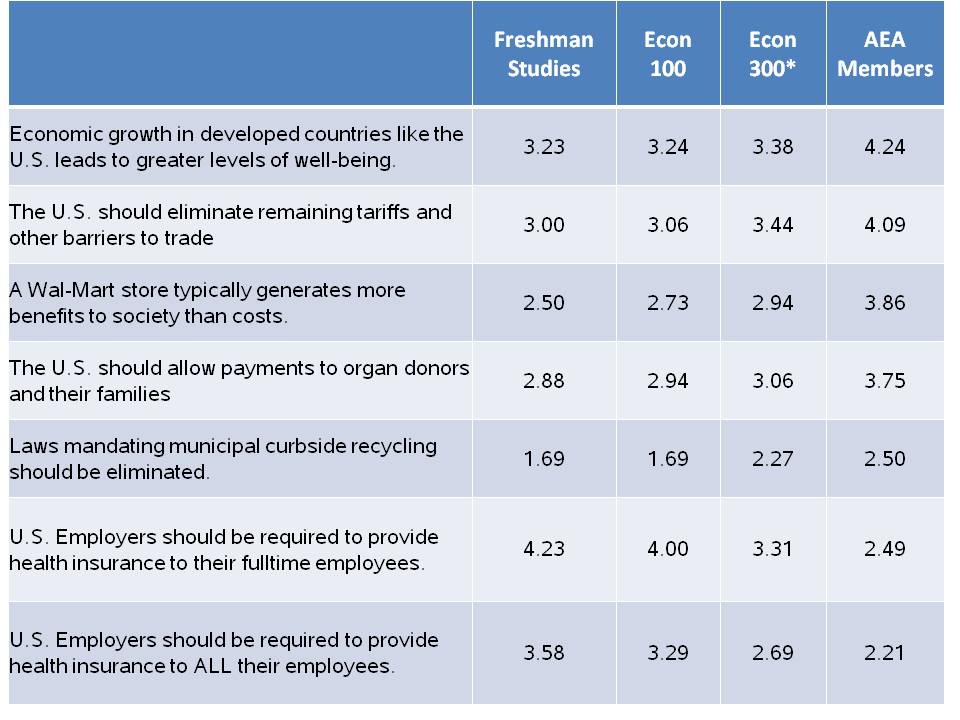
In the previous post, I mentioned the Robert Whaples survey of American Economic Association (AEA) members on their public policy views.  Of course, Whaples isn’t the only one with access to Survey Monkey, and with the help of some of my colleagues, we gave the same survey to students in Freshman Studies, Economics 100, and Economics 300 courses.

The Freshman Studies sample (n=26) should be fairly representative of incoming freshman population, as every student takes freshman studies and these students are allegedly distributed randomly across the sections.  I have data from two sections with a 90% response rate. The Econ 100 course is predominantly freshman as well, but is a much different cross section of the University, with 70% planning to major in economics or some other social science.  The Econ 300 is, of course, generally for students taking the first “major” step to joining Team Econ down here on Briggs 2nd.  It is well-worth noting that the Econ 100 (n=35) and Econ 300 students were surveyed at the beginning of the course,* not the end.   Perhaps next year we will switch that up.

The survey participants rate the questions on a 1-5 scale, with 1 being strongly disagree and 5 being strongly agree.

Here are selected results, sorted by the scores of AEA members:


Continue reading Lawrence Students v. Card-Carrying Economists

Budding Professors

My mentor and now colleague Mark Montgomery of Grinnell College has penned an essay on the social conventions of professors walking around with buds plugged in their ears.

It’s a cliché that people like me, whose computational experience began with punch cards, can feel overwhelmed by the explosion of electronic gadgets. But I find that the difficulties are less technical than emotional and social. Consider, again, my relationship to my beloved iPod. Is it OK for me to “wear” it around campus? Or does it undermine 165 years of institutional dignity for a gray-haired full professor to be seen strolling through the quads with two wires dangling from his head?

The article is in the Chronicle of Higher Education and, judging by the comments, is highly hilarious to our brethren.  What I respect about it  most, though, is that he manages to fit in a brief lesson on the economics of signalling near the end:

Ironically, I find that among the earphone-wearing public (that is, most people under 23), the iPod can actually enhance communication. With students I can use it to set the tone of a conversation before a single word has been uttered. Some examples: (1) One earphone removed and held poised an inch from my ear means I’m about to say: “If you want to discuss your exam grade, come to office hours.” (2) Both earphones removed, allowed to dangle: “Where is the assignment that was due on Monday?” (3) Earphones removed, wires wrapped around the iPod, device tucked in jacket pocket: “Why have I not seen you in class all week?”

Professor Montgomery at Schumptoberfest

Indeed.

For more from the good professor, see the essays at his website.

Professor Montgomery is tentatively slated to speak in our Economics Colloquium this coming year, so we look forward to that, too.  You can check out his research interests and publications here.

Squirreling Away Data

Spackler Data Security?

Is your internet service shoddy?  Do you find that your connection is in and out? Do you think major data centers have the same types of problems?

The answer to that last question appears to be yes.

In a wonderfully titled article, “Guns, Squirrels, and Steel: The Many Ways to Kill a Data Center,” Wired provides a nice rundown of the principal culprits (allusion here).

As the title indicates, squirrels can account for up to 15-20% of cable damage at some data centers. The other culprits include hunters shooting out insulators, lightning strikes, explosions, and thieves — like thieves thieves, not virtual ones.

For those of you unfamiliar with the scourge of squirrels, let me just say that there are significant resources dedicated to fending off these furry little guys, and there is no one right way to do it (see, for example, the classic Outwitting Squirrels: 101 Cunning Stratagems to Reduce Dramatically the Egregious Misappropriation of Seed from Your Birdfeeder by Squirrels).

101 ways.  And that’s just for bird feeders, not Amazon.com!

And the Outwitting Squirrels guide probably doesn’t include this or this, though honestly I haven’t consulted it lately.

The Good Ol Summit Time

As summer marches on, the financial situation in Europe remains unresolved, some economists are arguing that a devaluation and subsequent inflation of the Euro is in order (see Kenneth Griffin and Anil Kashy here and Martin Feldstein here). The Grumpy Economist, University of Chicago’s  John Cochrane, is skeptical and provides a helpful analogy:

Imagine that  your brother in law had been drinking too much for 40 years, perpetually on and off the sauce, never really able to give it up. He went  through a painful 12 step program and rehab, and finally quits the sauce for 10 years. He threw away all the liquor in the house. Then he loses his job. Is “one more big night out to soothe the pain, and then I’ll really really never do it again”  at all a credible plan?  That’s exactly what my normally sensible colleagues (see above) are advocating.

My guess is that most of our readership does not have brother-in-laws who have been drinking too much for 40 years, so I will give you something closer to home.

Summit EUphoria

Back when I was in college I had a friend who tended to fall behind a bit in his classes, something like accumulating large piles of debt.  At some point, of course, the debt would mount and he would reach a crisis situation, forcing him to face some unpleasant facts.  He would then of course have to develop a plan to “restructure” the debt — for instance, does this sound familiar?, getting an extension on a paper, strategically dropping a class, deciding which course he could get by without studying, etc…  And, remarkably, once the plan was in place, he would have some sort of celebration even prior to completing any of the work he had to do.

To my knowledge, he had no way of credibly committing to putting the plan in place. What I mean by that, of course, is that he generally didn’t put the plan in place.

I’m not sure whether he ever graduated, but I do know that he has been a very successful entrepreneur.  I’m not sure exactly what that does for our analogy.

On a not entirely unrelated note, Kevin “Angus” Grier at the Kids Prefer Cheese blog provides some visual insight in the salubrious effects of European summits on financial markets.

It’s summit time!

Friday Supernova

Who says the liberal arts are in peril?

As you probably know, back about 1300 years ago, in the year 724, there was a mysterious spike in Carbon 14 levels detected in the rings of Japanese cedar trees.  What you probably don’t know is that this spike coincided with an eerie “red crucifix” reported in the skies after sunset.

Well, undergraduate Jonathan Allen knew that and he put two-and-two together and posits that maybe the “red crucifix” may have been a supernova.

See here for the tree-warming story.

Wednesday Warning

Good old rock, nothing beats that

We occasionally will warn you of the many mysteries and potential dangers of robot nation.

Today we consider a simple battle of wits in a game of rock, paper, scissors with a robot opponent.

Back in the day, you could get a fair shake.

But today I refer you to the ever-awesome Kottke website, where we observe a much different outcome.

Here it goes: Rock, paper, scissors,…. shoot, I lost again.


About those Gowns

And now for our annual explanation of those caps and gowns, we return to a post from 2010:

In our continuing attempt to understand the world around us, today we take a look at the traditional graduation cap & gown.

Well, the first thing you need to know is that this dates back nearly 1000 years, and the academy is a notoriously conservative place. In the words of F.M. Conrford, in his advice to young academics, “Nothing should ever be done for the first time.”* The corollary here is that once we get started on something, it’s tough getting us to stop.

With that in mind, Slate.com tackles the regalia question for us:

Standard fashion around 1100 and 1200 A.D. dictated long, flowing robes and hoods for warmth; the greater a person’s wealth, the higher the quality of the fabrics. This attire went out of style around the Renaissance. But sumptuary laws, often designed to prevent people from dressing above their class, kept academics (who were relatively low in the social hierarchy) in simple, unostentatious robes through the 16th century. Thereafter, academics and students at many universities wore robes for tradition’s sake. At Oxford, robes were de rigueur until the 1960s and are still required at graduation and during exams.

And, of course, the Americans played along:

Chicago: My Kind of Gown

When American universities sprang up in the 17th and 18th centuries, they adopted many Oxbridge academic traditions, including robe-wearing…

The use of academic robes in the United States waned at the beginning of the 19th century, and after around 1810, most American colleges and universities used them only at formal academic ceremonies, if at all…. The tradition seemed on the cusp of extinction, but in the second half of the 19th century, there was a—somewhat mysterious—renewed interest in academic regalia.

It’s one thing to ask why we wear them, but entirely another to figure out what to wear. It seems that the students look pretty similar, but the faculty is a mishmash of colors and patterns (see, for example, the University of Chicago regalia to your right). That’s why it’s so nice that the American Council on Education provides this handy dandy academic costume guide (costume!). From that we learn this:

Tassel. A long tassel is to be fastened to the middle point of the top of the cap only and to lie as it will thereon. The tassel should be black or the color appropriate to the subject, with the exception of the doctor’s cap that may have a tassel of gold.

It’s worth noting that the color for the music discipline is pink, which is the answer to one question I got at dinner tonight about why the Con students have pink tassels and the College students wear black.  Well, it doesn’t answer it completely because many disciplines within the college have their own colors (e.g., economics is copper, science is yellow), so I’m going to go with “transaction costs” for the reason why the College side has black tassels.

The guide also elaborates on the history of regalia generally, and the more you read, the more, um, traditional it really is.

See you on stage.

*Nicked from Louis Menand’s excellent The Marketplace of Ideas: Reform and Resistance in the American Academy. See also, here.

Is Walker a Slight or a Heavy Favorite to Win the Wisconsin Recall?

Who are you going to believe?

Case 1:  According to the latest polls, “Gov. Walker Holds Slim Lead in Wisconsin, But with only one day to go the recall election appears far from decided…. Two new polls, released Sunday, have the governor out in front by a handful of percentage points, although in both surveys his lead is within the margin of error.”

Case 2: According to the “prediction market,” InTrade: Wisconsin Gov. Scott Walker to win the 5 June 2012 recall election 93.2% CHANCE.

I’ll have much more to say about prediction markets later this summer as we head into the general election, but suffice it to say that these markets tend to be more accurate than pollsters at predicting elections.  From a Journal of Economic Perspectives piece by Justin Wolfers:

In the political domain, Berg, Forsythe, Nelson and Reitz (2001) summarize the evidence from the Iowa Electronic Markets, documenting that the market has both yielded very accurate predictions and also outperformed large scale polling organizations… (and) the accuracy of the market prediction improves as information is revealed and absorbed as the election draws closer.

That is taken a bit out of context and is comparing national polls to certain political markets, but if it was my money, I’d bet on the market.   That is, right now the polls are running between a coin toss (50-50) and a slight advantage for Walker, perhaps 3:2.  In contrast, the prediction market has Walker at about a 15:1 favorite at this point.  So, to put this in perspective, suppose someone is tossing a coin and you believe it to be a fair coin.  You can lay a $9 on heads to win $10 or $1 on tails to win $10. Which side would you bet?

In calling this one early, it would seem the credibility of prediction markets on Briggs 2nd is now riding in the balance.

Canine Therapy at The Mudd

An important message from Librarian Pete Gilbert:

Stressed out by finals and the end of the school year? Need a study break? Join us for Canine Therapy 2012! Monday, June 4, 2:00-3:00pm on the Library Plaza. You’ll feel better for it…

The econ department will be sponsoring a large, championship-quality dog.

The Marketplace CAFE

Yes, I made it to the national airwaves this past week, thanks for asking (and thanks to Adrienne Hill for the interview).

The topic was the Corporate Average Fuel Economy (CAFE) standards, which have been controversial for a variety of reasons since their inception in the 1970s. The basic idea is simple enough, though: if the federal government mandates greater fuel efficiency, people will use less gas.  Because the CAFE standards are politically viable and gasoline taxes are not, the CAFE standards have withstood the test of time, including a beefier rule promulgated by the Obama Administration in 2009.

This week’s issue arose because gasoline tax revenue is funneled back to fund highways and mass transit. Ergo, if we use less fuel, there will be less tax revenue for highways and mass transit.  That is the conclusion of a Congressional Budget Office report from last week:

An increase of about 5 cents per gallon in the gasoline tax would be required to make up the shortfall in revenue projected as a result of the proposed CAFE standards.

And, so, man bites dog and consuming less fuel could lead to an increase in gasoline taxes, and the net result could be higher prices at the pump (Of course, federal gas taxes last went up during the pre-industrial era.  A primary reason for CAFE standards is that Congress is unwilling to move the gas tax off its $0.186/gallon level).

The report generated a minor media buzz, including this very short report on National Public Radio’s Marketplace program where I provided some unsurprising insight.

My authority on the subject stems from a paper I co-authored back in the day, “The Economics of CAFE Reconsidered: A Response to CAFE Critics and A Case for Fuel Economy Standards,” where we make a case that the CAFE standards are a reasonable complement to stiffer gasoline taxes (we also argue for much stiffer gasoline taxes).  I also have talked to US News and the Financial Times, among others. And I will talk to you, too, if you ask me about it.

For a very nice recent treatment, you might check this recent paper, “Automobile Fuel Economy Standards: Impacts, Efficiency, and Alternatives,” in the Review of Environmental Economics and Policy.

For some extremely tasty data, check out Environmental Protection Agency’s Light-Duty Automotive Technology and Fuel Economy Trends.  They’ve been doing this report for years, and I always learn something when I go through the new one.

Higher Math Scores or Better Rhetoric?

George Schultz and Eric Hanushek write in the Wall Street Journal that the poor performance of US students in mathematics, as evidenced by the OECD’s Programme for International Student Assessment (PISA), is undermining economic growth.

If we accept this level of performance, we will surely find ourselves on a low-growth path.

The chart on the right shows average GDP growth from 1960-2000 on the Y-axis and the PISA score on the X-axis, along with a lovely line fit that appears to show a nice, tight correlation between math and GDP growth.  Indeed, by pulling out Canada and the US the authors conclude:

Imagine a school improvement program that made us competitive with Canada in math performance (which means scoring approximately 40 points higher on PISA tests) over the next 20 years. As these Canadian-skill-level students entered the labor force, they would produce a faster-growing economy.

How much faster? The results are stunning. The improvement in GDP over the next 80 years would exceed a present value of $70 trillion. That’s equivalent to an average 20% boost in income for every U.S. worker each year over his or her entire career. This would generate enough revenue to solve easily the U.S. debt problem that is the object of so much current debate.

What’s remarkable about this conclusion, aside from the dubious causality of average test scores and the heroic extrapolations, is that the figure shows that the USA actually has higher GDP growth than Canada.  So, if GDP growth is the end goal, I wonder what Canada is doing to become more like us?

Maybe they need a good banking crisis.

Via the Cheesiest.

Taking Care of Business OR Bad Company?

I was just going through some work on the economics of higher education, and I came across this remarkable piece of scholarship* estimating the effect of studying on grades.  What a concept!

Of course, one would expect (or would hope to expect) that more studying results in higher grades, but how much studying and how much better? Can studying really make up for a lack of high school preparation or a deficit of intellect? Can smart kids really skate through?

Using data from Berea College, Ralph and Todd Stinebrickner provide a very, very nice framing reference for the relationship between incremental study time and the endowment of “book smarts” (measured by ACT scores):

[H]uman capital accumulation may be far from predetermined at the time of college entrance. For example, using results from our full sample, an increase in study-effort of one hour per day…is estimated to have the same effect on grades as a 5.21 point increase in ACT scores.

So while on the one hand hitting the books is certainly a plus, danger lurks around every video console:

In addition, the reduced form effect of being assigned a roommate with a video game is estimated to have the same effect on grades as a 3.88 point decrease in ACT scores.

Ouch.

For those looking for good examples of empirical work, this is a very high-quality example.  This seems to have “Senior Experience” written all over it.


* Ralph Stinebrickner & Todd Stinebrickner, 2008. “The Causal Effect of Studying on Academic Performance,” Frontiers in Economic Analysis & Policy, Berkeley Electronic Press, vol. 8(1)