It is that time of year where the days get longer, aided by a single leap and bound. This Saturday into Sunday, much of the US will push its clocks forward by one hour. Despite the “Daylight Savings” moniker, there is no actual daylight saved — it just shifts an hour from the morning to the evening. The consequences of this likely will affect whether some people live through the rest of March or not, as I pointed out in the New York Times Room for Debate section a few years ago. My contribution has to do with the changes in pedestrian fatality risks and total fatalities associated with the time change. I also wrote a more general piece for the Appleton Post-Crescent. Below is my semi-annual rehash of a previous post…
So, what does a time change look like? Glad you asked: The figure from the sunshine authority, Gaisma.com, shows daylight patterns for our own Appleton, Wisconsin. Each day starts with midnight at the bottom and goes to the top, and the months go left to right. The blue line is the dawn and the red the dusk.
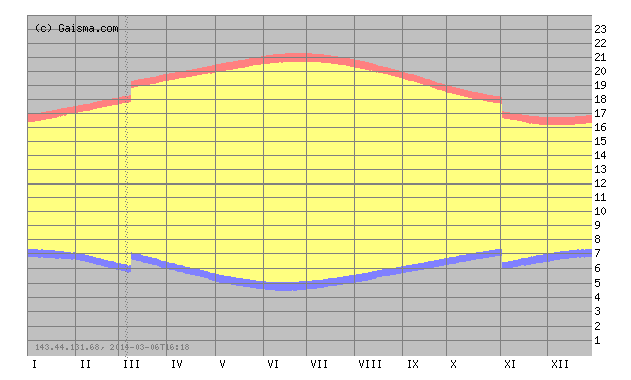
The switch to DST in March and the switch back to standard time in November are clear — they are the discontinuities (the “breaks”) in the sunrise and sunset curves. Because we “spring ahead” one hour, the sunrise time on Sunday morning will be one hour later than it was on Saturday. An early morning walk that was in that daylight on Saturday will be in the dark on Sunday. To have a sunrise at the same time as Saturday’s, we will have to wait until early April. The opposite happens in the evening. Sunset will be one hour later starting on Sunday. There will be less light in the morning, but more light in the evening.
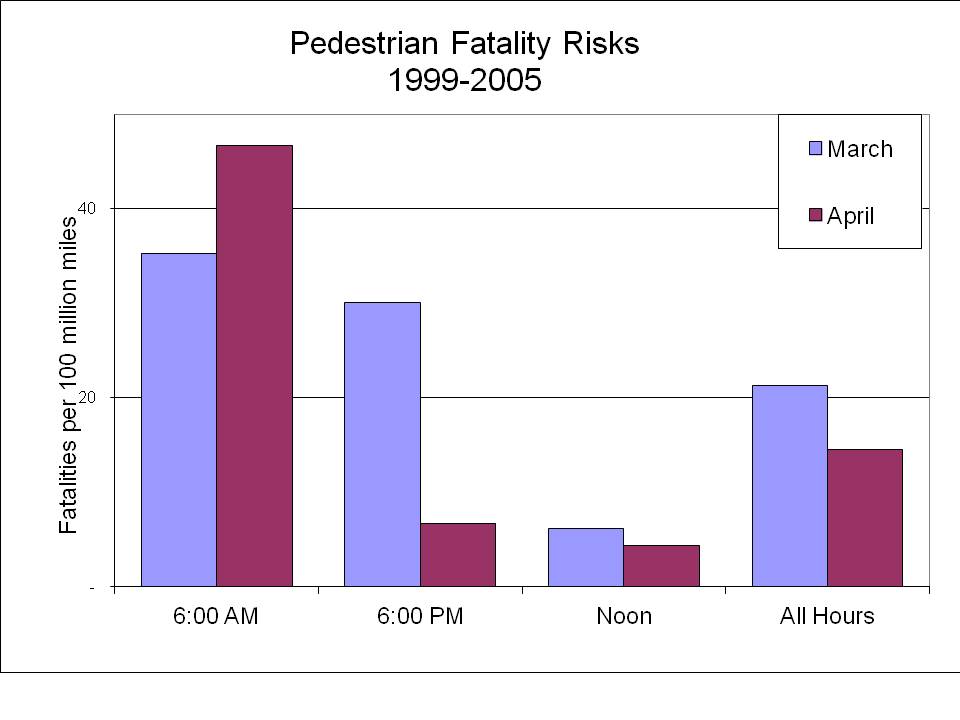
Light and visibility are extremely important determinants of traffic safety, particularly for pedestrians. Paul Fischbeck and I looked at data from 1999-2005 on fatalities and travel patterns, and determined that the morning risk increases about 30% per mile walked, while the afternoon risk falls close to 80%.
The figure below shows pedestrian fatality risks from 1999-2005. The blue and maroon bars show fatality risks per 100 million miles walked in March and April, respectively. Note that for the 6 a.m. time slot the risks increase about 30%, whereas for the 6 p.m. time slot the risks take a sharp nosedive. At midday the risks stay right about the same (we found no statistically significant difference in risks for that time period). Overall, total pedestrian fatalities decrease in the Spring both because risks fall more in the evening than they rise in the morning, and there are many more people out later in the day.
These data are rather crude in the presentation, as they do not focus specifically on the days leading up to and immediately following the time shifts, which is how researchers typically isolate the effects of the time change.
Here are some references for those interested:
S A Ferguson, D F Preusser, A K Lund, P L Zador, and R G Ulmer “Daylight saving time and motor vehicle crashes: the reduction in pedestrian and vehicle occupant fatalities,” American Journal of Public Health 1995 85:1, 92-95
J M Sullivan and M J Flannagan, “The role of ambient light level in fatal crashes: inferences from daylight saving time transitions,” Accident Analysis & Prevention, 2002 34:4, 487-498
D Coate and S Markowitz, “The effects of daylight and daylight saving time on US pedestrian fatalities and motor vehicle occupant fatalities,” Accident Analysis & Prevention, 2004, 36: 3 351-357
