Welcome to those of you who found the site via the Lawrence Today piece on the value (over replacement) of the liberal education. As promised, this post explains what is going on Figure 3.5 from Erik Brynjolfsson and Andrew McAfee’s Atlantic Monthly piece, “Why Workers are Losing the War Against Machines.” This is a really nice discussion that touches on the future of labor markets for skilled and unskilled workers, and I will use Brynjolfsson and McAfee’s e-book in my intro class during winter term.
The original source is Figure 4a of Daron Acemoglu and David Autor’s “Skills, Tasks and Technologies: Implications for Employment and Earnings,” a working paper from the National Bureau of Economic Research (NBER) that will find a home in the Handbook of Labor Economics (the authors’ PowerPoint presentation can be found here).
 At one level, the story is transparent. You can see over time that the wage premium for people with college degrees and graduate degrees have grown substantially, while high school graduates and dropouts actually seem to be losing ground since the early 1970s. That is the basic message.
The purpose of this post is simply to unpack the elements of this particular characterization of “changes in wages” to give an idea of how some truly great economists have addressed the problem. I hope that you will see why this characterization is likely to be more compelling than the plotting of raw data that we often spattered about these days.
To begin, note that all five of the education cohorts start at 0.0 in 1963, which is a way of normalizing the measures. Hence, the figure shows year-to-year changes in the wage rate, not the differences in absolute levels. Further, these changes are relative to the 1963 benchmark, not for year-to-year (though, clearly, you can infer year-to-year changes).
Although the title of the graph is “Changes in Wages,” the actual metric on the y-axis — composition-adjusted real log weekly wages — is a bit esoteric. The first part of this is the “composition adjustment,” which is done by estimating wages while also using statistical controls for factors like work experience, level of education, and sector of employment (gender is taken care of in the figure by focusing solely on full-time male workers). For example, if members of the graduate school cohort have average experience of 10 years in 1963 and 15 years in 1980, we would expect the wages to be higher for the latter cohort independent of the underlying trend. If the authors simply plotted the raw data, there would be an increase that could be explained by a factor other than the level of education, so Acemoglu and Autor adjust for these various factors when constructing this series.
Second, the measure is of “real” wages, meaning that the authors adjust for inflation. The wage increases represent increases in real purchasing power.
Third, the changes in wages are in “log” form, shorthand for “natural logarithm,” which means that the actual changes from the baseline are calculated by exponentiating the number. For example, the change in wages for the graduate school cohort appears to be about 0.6, where exp(0.6) = 1.82, meaning that inflation-adjusted wages for workers with graduate degrees have increased 82% since 1963. In contrast, the cohort with “some college” looks to be about 0.1, meaning about a 12% increase over the past 50 years. The changes in real wages for cohorts without any college have been stagnant or worse.
The figure shows that wage gains moved approximately at the same rates across cohorts — with reasonably healthy increases through the 1960s into the 1970s, and then stagnating. By the mid-1980s, however, the college wage premium began to kick in and the premium has continued to grow. Breaking down what accounts for the premium, it is clear that a healthy chunk of this premium has gone to those with graduate degrees, which would include lawyers, doctors, MBAs, and the like. Another portion of the premium is due to the relative decline in wages for those without college degrees (Acemoglu and Author paper, pp. 9-11). I often see writers talk about the decline in real wages for “middle class” workers since the early 1970s; certainly, for those without college degrees, real wages still have not completely recovered to levels seen in the early 1970s.
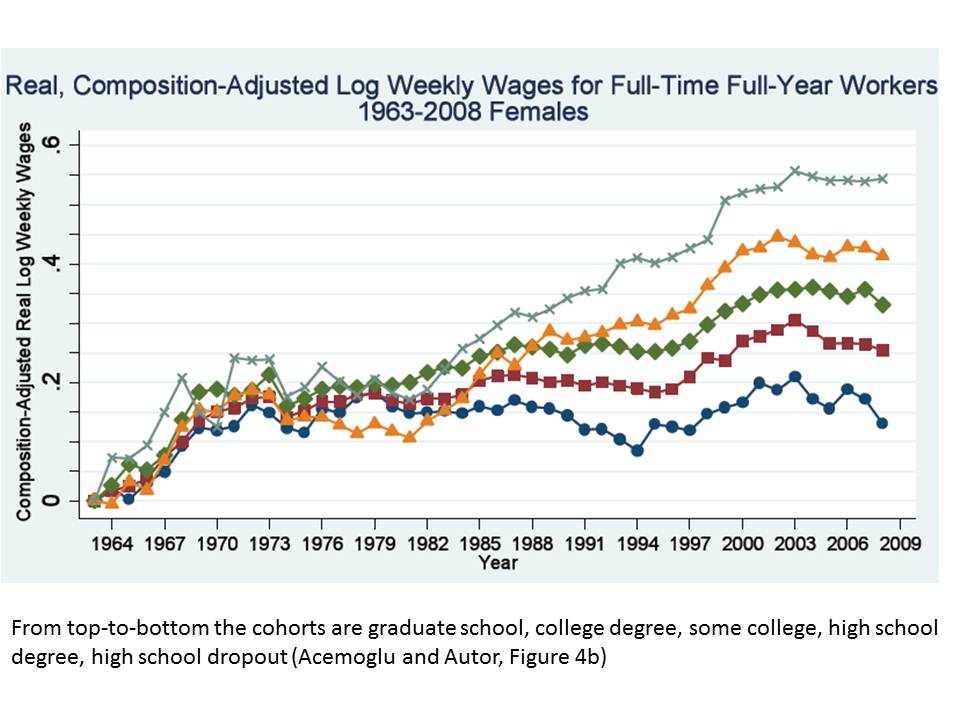 The changes in composition-adjusted real wages for females generally follows a similar trajectory, but the picture is not quite so bleak at the lower end of the education spectrum (figure at right; click to enlarge). It would probably take a whole additional post to go through why the authors key in on male wages, but one reason is that the labor force participation rate (LFPR) — the percentage of the population that is either working or looking for work — is more stable. The data certainly bear this out. The adult male LFPR was about 81% in 1963, and it has fallen to just over 70% today. During the same period, the LFPR for women has increased from about 37.5% to just under 60%. This complicates matters further, because with male wages falling, we would expect them to work less (and they do), and with female wages rising, we would expect them to work more (and they do). The basic idea of using male full-time wages as the baseline, then, is that we would expect that that decision is less sensitive to changes in wages. Another way to put it is that the male labor supply curve is more likely to be vertical than the female supply curve. I’ll leave it at that.
As a final note, with the proliferation of data availability in the internet age, it is common to see authors and bloggers plot raw data and then provide some ad hoc theory as to what is going on. So I found the Acemoglu and Autor piece refreshing in its attention to detail (see here for another example on gender differences). For those of you interested in further reading on the past and future of labor markets, I recommend the Brynjolfsson & McAfee short book for a readable overview, and the Goldin & Katz treatise for an exhaustive look. If you don’t have time (or the energy) for the latter, you might try Acemoglu and Autor’s review of the book in the Journal of Economic Literature (ungated version here).