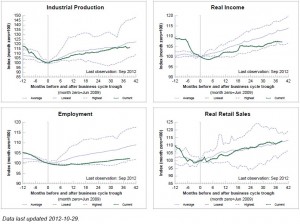
Much political debate – more appropriate described as hot or even toxic air – attempts to address how poorly the economy has recovered from what Reinhardt and Rogoff call The Great Contraction. As noted in Professor Gerard’s recent post, R and R argue– as they have done many times before – that recoveries from balance sheet or financial crisis recessions are much slower than those related to “garden variety” declines in aggregate demand. So what does the current recovery look like? One way to answer this is to view the four major indicators that the National Bureau of Economic Research’s Business Cycle Dating Committee uses to identify the beginning and ending points for recessionary and expansionary periods. Fortunately, our friends at the Federal Reserve Bank of St. Louis have done all the hard work. As can readily be seen below (or more clearly here), industrial production and real retail sales have grown roughly in line with the average of past recessions. Real income started to grow similar to past history, but for the past 18 months growth has slowed markedly. The employment growth pattern, however, has shown the least responsiveness to the medicinal help provided by the Federal Reserve and other governmental policies. This suggests that “financial crisis” related recessions require both more time and different policies than demand deficient recessions not induced by too much debt. I will have more to say about why in future posts.
