daylight saving

Tag: daylight saving

Into the darkness they go, the wise and the lovely

Those of you who are acquainted with my writing on this blog probably know that (a) I study mortality risks, and (b) I sometimes comment on how these risks change when the clocks spring forward and fall backward.   This fall is no exception, as I have a piece in the venerable Costco Connectionmaking the case that maybe keeping Daylight Saving Time as is wouldn’t be the worst thing to happen to the world.  (I could have made the case the other way, as the policy decision here is very unclear, which tends to favor the status quo).

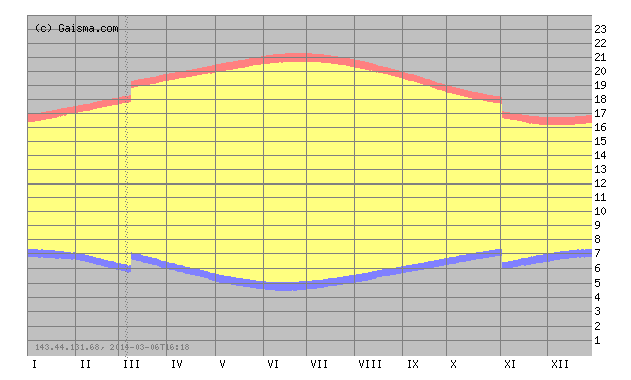
As per usual, the the remarkable Gaisma.com site shows us what’s at stake here in Appleton.  The break in the series starting in month 11 is upon us:

The Appleton Day

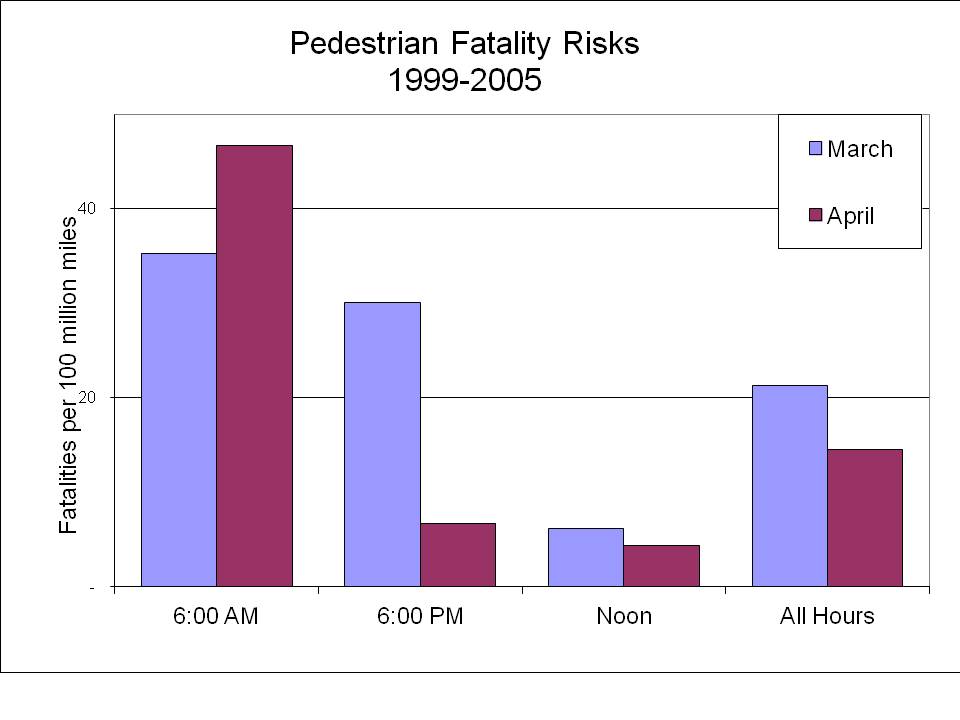
What does this mean for you?  Well, starting Sunday it is going to be dark at 5 p.m.  meaning that you are far more likely to get hit by a car at 5 p.m. next week than you are this week.   When I say “far more likely,” our estimate is that the risk is about three times as high!

Of course, you are also far less likely to get hit at 6 a.m. in the extremely unlikely event that you are out 6 a.m.  But, notice, but January 1 the sun won’t rise until after 7 a.m., and if DST was permanent, that would be 8 a.m.   Sunlight is the ultimate scarce resource.

Here is our previous coverage.

* The picture in the Costco piece is of me enjoying some daylight at Wrigley Field. Should Daylight Saving Time be eliminated? Of course not! More daylight means more daytime ball games.

Springing Forward

It is that time of year where the days get longer, aided by a single leap and bound.  This Saturday into Sunday, much of the US will push its clocks forward by one hour.  Despite the “Daylight Savings” moniker, there is no actual daylight saved — it just shifts an hour from the morning to the evening.   The consequences of this likely will affect whether some people live through the rest of March or not, as I pointed out in the New York Times Room for Debate section a few years ago.  My contribution has to do with the changes in pedestrian fatality risks and total fatalities associated with the time change.  I also wrote a more general piece for the Appleton Post-Crescent.  Below is my semi-annual rehash of a previous post…

So, what does a time change look like?  Glad you asked:  The figure from the sunshine authority, Gaisma.com, shows daylight patterns for our own Appleton, Wisconsin.  Each day starts with midnight at the bottom and goes to the top, and the months go left to right.  The blue line is the dawn and the red the dusk.

The Appleton Day
Appleton Time

The switch to DST in March and the switch back to standard time in November are clear — they are the discontinuities (the “breaks”) in the sunrise and sunset curves.  Because we “spring ahead” one hour, the sunrise time on Sunday morning will be one hour later than it was on Saturday.  An early morning walk that was in that daylight on Saturday will be in the dark on Sunday.  To have a sunrise at the same time as Saturday’s, we will have to wait until early April.  The opposite happens in the evening.  Sunset will be one hour later starting on Sunday.  There will be less light in the morning, but more light in the evening.

Light and visibility are extremely important determinants of traffic safety, particularly for pedestrians.  Paul Fischbeck and I looked at data from 1999-2005 on fatalities and travel patterns, and determined that the morning risk increases about 30% per mile walked, while the afternoon risk falls close to 80%.

The figure below shows pedestrian fatality risks from 1999-2005.  The blue and maroon bars show fatality risks per 100 million miles walked in March and April, respectively.  Note that for the 6 a.m. time slot the risks increase about 30%, whereas for the 6 p.m. time slot the risks take a sharp nosedive.  At midday the risks stay right about the same (we found no statistically significant difference in risks for that time period).  Overall, total pedestrian fatalities decrease in the Spring both because risks fall more in the evening than they rise in the morning, and there are many more people out later in the day.

Ped Spring

These data are rather crude in the presentation, as they do not focus specifically on the days leading up to and immediately following the time shifts, which is how researchers typically isolate the effects of the time change.

Here are some references for those interested:

S A Ferguson, D F Preusser, A K Lund, P L Zador, and R G Ulmer “Daylight saving time and motor vehicle crashes: the reduction in pedestrian and vehicle occupant fatalities,” American Journal of Public Health 1995 85:1, 92-95

J M Sullivan and M J Flannagan, “The role of ambient light level in fatal crashes: inferences from daylight saving time transitions,” Accident Analysis & Prevention, 2002 34:4, 487-498

D Coate and S Markowitz, “The effects of daylight and daylight saving time on US pedestrian fatalities and motor vehicle occupant fatalities,” Accident Analysis & Prevention, 2004, 36: 3 351-357

Semi-Annual Daylight Savings Post

Those of you who follow this blog have probably noticed that I (a) study mortality risks, and (b) that I have something to say about how those mortality risks change when the clocks spring forward and fall backward.   This fall is no exception, as I am quoted in a blurb on the Time magazine blog about how things are about to get more dangerous late in the day as a result of the time change.

Behold!:   The break in the series starting in month 11:

The Appleton Day


That’s daylight for Appleton, Wisconsin, from the remarkable Gaisma.com site.  Starting Sunday it is going to be dark at 5 p.m.  meaning that you are far more likely to get hit by a car at 5 p.m. next week than you are this week.   When I say “far more likely,” our estimate is that the risk is about three times as high!

Of course, you are also far less likely to get hit at 6 a.m. in the extremely unlikely event that you are out 6 a.m.  But, notice, but January 1 the sun won’t rise until after 7 a.m., and if DST was permanent, that would be 8 a.m.   Sunlight is the ultimate scarce resource.

Here is our previous coverage.


More Light?!?

I am one of the contributors to the New York Times Room for Debate section today on Daylight Saving Time.  My contribution has to do with the changes in pedestrian fatality risks and total fatalities associated with the time change. (UPDATE:  There is also a piece up in the Sunday Appleton Post-Crescent).

So, what does a time change look like?  Glad you asked:  The figure from the sunshine authority, Gaisma.com, shows daylight patterns for our own Appleton, Wisconsin.  Each day starts with midnight at the bottom and goes to the top, and the months go left to right.  The blue line is the dawn and the red the dusk.

The Appleton Day
Appleton Time

The switch to DST in March and the switch back to standard time in November are clear — they are the discontinuities (the “breaks”) in the sunrise and sunset curves.  Because we “spring ahead” one hour, the sunrise time on Sunday morning will be one hour later than it was on Saturday.  An early morning walk that was in that daylight on Saturday will be in the dark on Sunday.  To have a sunrise at the same time as Saturday’s, we will have to wait until early April.  The opposite happens in the evening.  Sunset will be one hour later starting on Sunday.  There will be less light in the morning, but more light in the evening.

Light and visibility are extremely important determinants of traffic safety, particularly for pedestrians.  Paul Fischbeck and I looked at data from 1999-2005 on fatalities and travel patterns, and determined that the morning risk increases about 30% per mile walked, while the afternoon risk falls close to 80%.

The figure below shows pedestrian fatality risks from 1999-2005.  The blue and maroon bars show fatality risks per 100 million miles walked in March and April, respectively.  Note that for the 6 a.m. time slot the risks increase about 30%, whereas for the 6 p.m. time slot the risks take a sharp nosedive.  At midday the risks stay right about the same (we found no statistically significant difference in risks for that time period).  Overall, total pedestrian fatalities decrease in the Spring both because risks fall more in the evening than they rise in the morning, and there are many more people out later in the day.

Ped Spring

These data are rather crude in the presentation, as they do not focus specifically on the days leading up to and immediately following the time shifts, which is how researchers typically isolate the effects of the time change.

Here are some references for those interested:

S A Ferguson, D F Preusser, A K Lund, P L Zador, and R G Ulmer “Daylight saving time and motor vehicle crashes: the reduction in pedestrian and vehicle occupant fatalities,” American Journal of Public Health 1995 85:1, 92-95

J M Sullivan and M J Flannagan, “The role of ambient light level in fatal crashes: inferences from daylight saving time transitions,” Accident Analysis & Prevention, 2002 34:4, 487-498

D Coate and S Markowitz, “The effects of daylight and daylight saving time on US pedestrian fatalities and motor vehicle occupant fatalities,” Accident Analysis & Prevention, 2004, 36: 3 351-357


Annual Daylight ‘Savings’ Plea

Every year about this time I like to remind our students to be careful crossing the street.  Some back-of-the envelope calculations we did once upon a time suggest that the time change is a very dangerous time for walkers at dusk.  (It is also true that it is now safer in the morning, but I’m not sure I want to counsel you to be less safe in the morning).

This is a story from the Pittsburgh Post-Gazette:

“The change that’s going to occur on Sunday is going to have some pronounced effects on your risks of walking between 5 p.m. and 7 p.m.,” Dr. Gerard said last night. “Basically, these are the hours when it’s just getting dark. Next week at this time, it will be pitch black. But people walking and people driving won’t have adjusted. The baseline risk for getting killed is almost tripled.”

Their study of pedestrian fatalities from 1999-2005 shows that there is an average of 37 more U.S. pedestrian deaths around 6 p.m. in November compared to October. That amounts to an increase of 186 percent.

No such jump was seen for drivers or passengers in cars.

“It’s astonishing,” Dr. Gerard said of the data. “It’s particularly worse right at the switch date, [when the average increases] two people a day for the next couple weeks, until the adjustment is made.”

This is roughly the same story from the Associated Press.

Here’s some more self-promotion with a bit more discussion of Daylight Savings writ large from the Organizations and Markets blog.

Daylight… Savings?

These days we don’t set back clocks very much any more, but instead our cell phones tell us that it must be the end of daylight saving time (although our cell phones do set us back quite a bit).

Dali clocks
Dali: The Persistence of Memory

The idea of daylight saving is famously attributed to Benjamin Franklin, but it was first introduced only about a hundred years ago. It has been policy in most of the US for about 50 years.

But does it really save energy? Surprisingly little research seems to have been done about that question. A 2008 NBER working paper considers the issue, taking advantage of a “natural experiment” in Indiana, where some counties used DST while others did not until 2006, when DST was sanctioned for all of the state. (Since it is often not possible to create lab experiments to resolve empirical questions in economics, we must rely on so-called “natural experiments” and a mysterious practice called “econometrics.”) Here is what the authors, Matthew J. Kotchen and Laura E. Grant, find:

The history of DST has been long and controversial. Throughout its implementation during World Wars I and II, the oil embargo of the 1970s, more consistent practice today, and recent extensions, the primary rationale for DST has always been the promotion of energy conservation. Nevertheless, there is surprisingly little evidence that DST actually saves energy. This paper takes advantage of a unique natural experiment in the state of Indiana to provide the first empirical estimates of DST effects on electricity consumption in the United States since the mid-1970s. The results are also the first-ever empirical estimates of DST’s overall effect.

Our main finding is that—contrary to the policy’s intent—DST results is an overall increase in residential electricity demand. Estimates of the overall increase in consumption are approximately 1 percent and highly statistically significant. We also find that the effect is not constant throughout the DST period: there is some evidence for an increase in electricity demand at the spring transition into DST, but the real increases come in the fall when DST appears to increase consumption between 2 and 4 percent. These findings are generally consistent with simulation results that point to a tradeoff between reducing demand for lighting and increasing demand for heating and cooling. According to the dates of DST practice prior to 2007, we estimate a cost to Indiana households of $9 million per year in increased electricity bills. Estimates of the social costs due to increased pollution emissions range from $1.7 to $5.5 million per year.

Addendum: Watch your step!