Merton Finkler

Author: Merton Finkler

Man vs. the Machine. Man is Losing

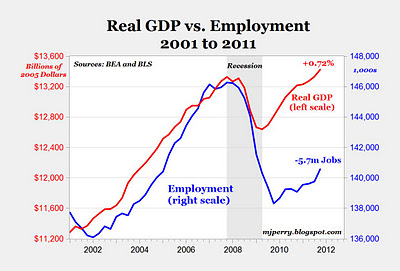
This week many of you are reading Brynjolfsson and McAfee’s book Race Against the Machine.  The authors make reference to a September 28, 2011 Wall Street Journal article by Kathleen Madigan entitled “It’s Man vs. Machine and Man is Losing.”  Madigan provides the chart below to illustrate the relative growth of equipment and software in comparison with payroll employment since the trough of the recession in June 2009.

As I have previously argued here and here, Madigan notes how the relative price of labor compared to capital is consistent with the pattern shown in the above chart.  Again, job creation clearly is quite difficult if the incentives are perverse.


Manufacturing Matters or Does It? Two Democratic Former CEA Chairs Battle it Out

In his State of the Union Address, President Obama highlighted the importance of providing special treatment for U.S. manufacturing through tax breaks and other forms of direct support.  In a February 4th op-ed piece in the New York Times, Christina Romer, the first Chair of President Obama’s Council of Economic Advisors (CEA) finds the arguments for such special treatment less than compelling.  In response, in a February 10th New York Times Economix blogposting, Laura D’Andrea Tyson, the Chair of President Clinton’s CEA, makes the case for why manufacturing deserves such support.  This blog posting summarizes their arguments.  Read the full articles for yourselves and respond by indicating which argument you find more compelling.

Professor Romer makes the following points in arguing that special treatment for manufacturing is unnecessary.

  1. No market failure specific to manufacturing exists.
  2. Innovation takes time to commercialize, thus special treatment makes sense; however, innovation is far from limited to manufacturing.
  3. National defense needs must be met but such needs do not map easily onto manufacturing. The problem, of course, becomes identifying in some objective way which industries (firms?) are essential to the national defense.
  4. Manufacturing industries have not been great job creators, as the share of employment tied to manufacturing has declined markedly in the past 30 years.  Technology and rapid productivity growth have led to not only a reduced need for workers but an increased need for more high skilled workers.
  5. Improved income distribution is not well served by a specific focus on job creation in manufacturing.  It is better served by direct attention to policies that will raise the skill levels of the population in a way that matches the needed capabilities.

Professor Tyson begs to differ.  She highlights the recent increase in manufacturing jobs as well as the need to strengthen U.S. competitiveness in manufacturing.  Specifically, she makes the following points:

  1. The U.S. economy needs to be rebalanced towards export production, and manufacturing goods make up 60% of the exports of goods and services.
  2. Manufacturing jobs are highly productive and provide relatively high compensation to workers; thus, we should encourage such job creation as a way to raise the average level of worker compensation.
  3. Manufacturing companies play a key role in innovation.  They employ the majority of scientists and engineers in the U.S. and cover 68% of business R & D (research and development) dollars.
  4. Increased manufacturing activity will assist in keeping R & D in the U.S. rather than see it outsourced along with lower skilled employment.

Both Romer and Tyson support extension of the R & D tax credit and efforts to improve the skills of the American workforce.  Clearly, they disagree, especially given current and prospective budgetary pressures, how narrowly focused these policies should be.  With whom to you agree?

GDP Growth vs. Employment Growth

At last, the level of real GDP has rebounded past its previous peak in the fourth quarter of 2007.  Clearly, the trough for employment was both much deeper and trailed that for GDP.  In contrast, the recovery for real GDP has been more rapid as well.   Financial repression (extremely low interest rates) must be part of the story behind this chart.  Clearly, an increased cost of labor relative to capital induced a capital intensive recovery.

Low Interest Rates: the Addictive Policy Drug of Choice

Satyajit Das, in today’s Financial Times, argues that low interest rates generate a variety of economic distortions that expand rather than address structural problems in economies (whether those of the U.S., Europe, or elsewhere.)  These effects are especially pernicious when real interest rates (that is market interest rates minus the expected inflation rate) are negative.  He provides a laundry list of “side effects” to this economic drug of choice.

1.  Encourages the substitution of capital for labor. Is it any surprise that employment has been slow to respond eventhough GDP is now higher than it was at the beginning of the last recession?

2. Encourage the substitution of debt for equity funding

3. Discourage savings, especially when real rates are negative.  Of course, if households have a particular wealth target, low rates could induce additional savings.

4. Create a funding gap for defined benefit pension plans (which means either reduced benefits or attempts to increase returns through more risky financing)

5. Feed asset price inflation through the purchase of risky assets (related to point 4)

6. Reduce the cost of holding money (which inhibits the flow of capital to worthwhile activities)

7. Allow banks to borrow cheaply (from depositors) and achieve their income targets through purchase of governmental securities rather than through lending to the private sector

8. Distort currency values as deviations in interest rates across countries is one of the drivers of short term capital flows

9. Induce a reliance on low interest rates to continuously fuel aggregate demand

For the most part, those who argue for extended periods of low interest rates believe that aggregate demand drives aggregate output. They tend to underplay the importance of structural change in the economy (such as labor market, regulatory, or tax policy reform); such change cannot be addressed by replacing depressed elements of aggregate demand with policy induced aggregate spending.  The day of reckoning is just extended, not cancelled.   Just ask the Europeans.

U.S. Exports. Where is U.S. Comparative Advantage?

Some of you might answer industrial machines.  Not a bad answer.  That’s #3 at $37B for the first 11 months of 2011.  Others might answer civilian aircraft.  Again, this has been a traditionally strong export industry.  Guess what, it comes in at #10 with $27B for the first 11 months on 2011.  How about engines for civilian aircraft?  #15 on the list at $21.6B.  The correct answer, believe it or not is petroleum products at $87.5B, more than twice the amount for #2, pharmaceutical preparations.

As the Bureau of Economic Analysis puts it:

Fuel exports, worth an estimated $88 billion in 2011, have surged for two reasons:

1. Crude oil, the raw material from which gasoline and other refined products are made, is a lot more expensive. Oil prices averaged $95 a barrel in 2011, while gasoline averaged $3.52 a gallon — a record. A decade ago oil averaged $26 a barrel, while gasoline averaged $1.44 a gallon.

2. The volume of fuel exports is rising. The U.S. is using less fuel because of a weak economy and more efficient cars and trucks. That allows refiners to sell more fuel to rapidly growing economies in Latin America, for example. In 2011, U.S. refiners exported 117 million gallons per day of gasoline, diesel, jet fuel and other petroleum products, up from 40 million gallons per day a decade earlier.”

The United States has become a net exporter of fuel for the first time since 1949.

Top 15 U.S. Exports, January-November 2011


Rank

Export Category

 Jan.-Nov. 2011 (millions)  

1

Petroleum products

$87,543

2

Pharmaceutical preparations

$37,547

3

Industrial machines, other

$37,456

4

Semiconductors

$36,898

5

Chemicals-organic

$32,514

6

Plastic materials

$30,219

7

Telecommunications equipment

$29,885

8

Electric apparatus

$29,147

9

Nonmonetary gold

$27,821

10

Civilian aircraft

$27,179

11

Medicinal equipment

$26,591

12

Computer accessories

$26,520

13

Chemicals-other

$24,150

14

Industrial engines

$23,246

15

Engines-civilian aircraft

$21,648


Even Some Keynesian Economists Appreciate Milton Friedman

Brad DeLong, UC Berkeley economist and ardent Keynesian, wrote an obituary for Milton Friedman when he died in 2006.  DeLong requires that his introductory economics students read Free to Choose, authored by Friedman and his wife Rose.  Why does ardent Keynesian DeLong impose this burden on this students?  Here’s his answer based on a statement made by John Stuart Mill:

“Sharpen their wits, give acuteness to their perceptions, and consecutiveness and clearness to their reasoning powers: we are in danger from their folly, not from their wisdom; their weakness is what fills us with apprehension, not their strength.”


For every left-of-center American economist in the second half of the twentieth century, Milton Friedman (1912-2006) was the incarnate answer to John Stuart Mill’s prayer. His wits were smart, his perceptions acute, his arguments strong, his reasoning powers clear, coherent, and terrifyingly quick. You tangled with him at your peril. And you left not necessarily convinced, but well aware of the weak points in your own argument.

He concludes his piece with the following point.

For right-of-center American libertarian economists, Milton Friedman was a powerful leader. For left-of-center American liberal economists, Milton Friedman was an enlightened adversary. We are all the stronger for his work. We will miss him.

I encourage you to read the entire obituary.  It’s worth your time.

“Made in China.” What Does It Mean?

The U.S. has been running large trade deficits with China.  Many view this result as arising from the excessive purchase of goods that carry the “Made in China” label.  Hale and Hobijn, in a recent Federal Reserve Bank of San Francisco Economic Letter, provide evidence to the contrary.  They use data from several U.S. governmental sources to answer three questions:

  1. What portion of U.S. consumer spending comes from goods labeled “Made in China” and what portion from goods “Made in the U.S.”?
  2. What part of the cost of goods labeled “Made in China” comes from valued added in China in contrast with what portion arises from valued added by U.S. economic activity?
  3. What part of U.S. consumer spending comes from direct purchases of goods imported from China or from intermediate inputs that came from China?

Their answers are as follows:

  1. 2.7% of U.S. personal consumption expenditures come from goods labeled “Made in China” and 88.5% come from goods “Made in the U.S.”
  2. Of the 2.7% noted above, approximately 1.2% reflects the direct cost of imported goods. in other words, 55.6% of goods labeled “Made in China” can be attributed to services added in the U.S.
  3. The total imported content of personal consumption expenditures that comes from goods and services imported from China equals 1.9% of which 0.7% can be attributed to intermediate inputs from China.

Given these results, why is it the common perception that a much larger portion of goods consumed in the U.S. come from China.  The answer can be inferred from Table 1 in the report, which indicates that 35.6% of clothing and shoe expenditures bear the label “Made in China” and 20.0% of furniture and household equipment bear the same level.  These two categories, however, only account for 3.4% and 4.7%, respectively, of U.S. personal consumption expenditures.

These data suggest that our concern with the purchase of imports from China is overblown and that a tariff on Chinese goods will have modest, if any, effect on aggregate U.S. personal consumption.

Our Macroeconomic Future: A Chaos Theory for Investors.

Neel Kashkari, managing director and head of global equities for PIMCO, has recently posited an array of possible scenarios for America and Europe and employs a simplified version of chaos theory to sort through the results. Kashkari was Secretary of Treasury Hank Paulson’s assistant; he worked directly with implementing the Troubled Asset Relief Program (TARP.)  He plays a significant role in Andrew Ross Sorkin’s book Too Big to Fail.  The movie, starring William Hurt, does a nice job reflecting the book.

Western economies (mostly governments and households) have loaded themselves with debt that under most scenarios is not sustainable. Kashkari indicates the following five options policy makers have as well as the potential consequences for investors. Check out his analysis.
1. Austerity and deflation
2. Explicit default
3. Mild inflation
4. Runaway inflation
5. Miraculous growth

Which scenario do you think is most plausible? Least plausible? Do your answers differ for the U.S., Europe, and Japan? Why or why not?

Is Capitalism Sustainable?

During the winter term, we will focus on visions of the world economy and the role of economics. The Backhouse and Bateman book puts these topics in sharp relief.  This discussion continues questions raised by Schumpeter, Hayek, Keynes and many others. In a recent Project Syndicate article, Kenneth Rogoff, co-author of This Time is Different, argues that some version of capitalism will continue to exist because there are few viable alternatives. Furthermore, he argues that European welfare state versions and the Chinese authoritarian version have yet to prove their sustainability. Of course, the contemporary version of capitalism will need to make some serious adjustments to be sustainable. Rogoff posits the following:

In principle, none of capitalism’s problems is insurmountable, and economists have offered a variety of market-based solutions. A high global price for carbon would induce firms and individuals to internalize the cost of their polluting activities. Tax systems can be designed to provide a greater measure of redistribution of income without necessarily involving crippling distortions, by minimizing non-transparent tax expenditures and keeping marginal rates low. Effective pricing of health care, including the pricing of waiting times, could encourage a better balance between equality and efficiency. Financial systems could be better regulated, with stricter attention to excessive accumulations of debt.

Jim Lyon and the World of Money and Banking

Thursday, you will have two opportunities to engage with Jim Lyon, Lawrence alum and First Vice President of the Federal Reserve Bank of Minneapolis.  He will be discussing “Too Big to Fail” and the Dodd-Frank Act response at 9:00 in Money and Monetary Policy (Briggs 225).  He also will chair a mock Federal Open Market Committee meeting in which students in the course will represent members of the Board of Governors and Presidents of the 12 district Federal Reserve Banks.  You are welcome to join us for either part of the class.

At 4:30, we will have an Econ Tea with Mr. Lyon as well.  This will be an open and free-wheeling session for which the topic will be “Everything you always wanted to know about money and banking and ARE NOT afraid to ask.”  Come for the discussion or just come for the cookies and tea.

Income Inequality Dynamics Matter

In a post two days ago, I highlighted the CBO report on the change in income inequality in the United States between 1979  and 2007.  The last sentence of that blogposting opines that the households represented in each quintile change over time; therefore, it’s not necessarily those who were in the top 1% in 1979 who made the massive gains in share of income and remained in the top 1% in 2007.

A recent Federal Reserve Bank of Minneapolis report highlights the dynamics of household movement across income quintiles during the 2001 to 2007 period.  The chart below shows that 44% of those in the bottom bracket in 2001 escaped to higher brackets by 2007 and that 34% of those in the highest quintile fell to at least the second quintile.  Longitudinal studies of particular households are most useful if we wish to understand what has happened to the distribution of household incomes over time.  The CBO study does not address the question, but the Panel Study of Income Dynamics selects a relative short and volatile period for its reference points.

How does this all matter?  It matters in that policy makers respond to such information to reshape both the regulatory structure and income tax  policies.  Given budgetary impasses that have characterized the past year, our legislators have not been able to reach any sort of consensus on how to do three things 1) ensure that the tax system creates appropriate incentives for generating growth,  2) put the US budgetary future on a sustainable path, and 3) create an efficient and equitable tax structure.  Will we again fail to take the opportunity to reach such desiderata?   What do you think?

Trends in the Distribution of U.S. Household Income

The “official scorekeeper” for Congress, the Congressional Budget Office, has just released a report on how the distribution of household income has changed from 1979 (when coincidentally I came to Lawrence) to 2007.  Their bottom line result is displayed in the figure below.  The “CBO estimates that the dispersion of market income grew by about one-quarter between 1979 and 2007, while the dispersion of after-tax (and governmental transfers) income grew by about one third.”  In particular, the share of after-tax, after transfer household income that accrued to those with the highest 1% of income grew from 8% in 1979 to 17% in 2007.  One should be a bit cautious about these comparisons since the there is a lot of movement in and out of different income brackets.  In short, it’s unlikely that most of the households counted in the 1979 calculation are in the 2007 calculation.  I encourage you to read the summary or the full report.

Who Won the Nobel Prize in Economics This Year? Professor Finkler’s Mentors, That’s Who

Most of you have probably never heard of either Tom Sargent or Chris Sims.  I’m not surprised; however, if you are an economics major at Lawrence, they have influenced how you have been taught.  I learned macroeconomics from Sargent.  His emphasis on the microfoundations of macroeconomics forms the base of how I think about macro questions.  In short,  a strong understanding of labor markets and how they work is critical to serious macroeconomic policy making.  Few of our decision-makers today understand that link.  Stated differently,  Okun’s Law (for every 2 percentage points that output is below potential output, the unemployment rate is 1 percentage point above its “natural” level) is an empirical relationship, not a theoretical one, that is if you are not a reductionist (to simple correlations.) Sargent convinced me that to reduce the unemployment rate in this country, one’s understanding must go well beyond how monetary and fiscal policy affect aggregate demand.

Chris Sims, a first rate econometrician, has addressed the fundamental questions of causality in macroeconomics, especially time series causality.  For those of you without a clue what this means, he tried to solve the chicken (money growth) and egg (GDP growth) problem; which came first?   His answer came in a 1972 American Economic Review paper entitled “Money, Income and Causality.”  Given his award, my students in Money and Monetary Policy will have an opportunity to work through this paper later this term.  Of course, Sims did not stop there.  No reductionist he, he broadened the question to ask of the variables that matter in macroeconomic discussion (Real GDP, Unemployment rate, stock of money, wages, the price level, and import prices), how do they relate to one other.  This paper, published in Econometrica in 1980 under the title “Macroeconomics and Reality”, is a much tougher read.  The conceptual direction and the results, however, are not hard to understand.  Sims argued that we should learn how the histories of each of these variables are related to each another.  He developed Vector Autoregression Techniques to answer this question.  These techniques have been embedded in contemporary econometrics software packages and in the work of many macroeconomists.  Despite the title of the paper, Sims did not believe he had found “the holy grail”, but he believed that an clear understanding of the time series relationships amongst the key macro  variables was essential to know where to look for it.

Of course, I am happy to discuss their work with any and all interested.  I am honored to have been a student of both of these creative economists and celebrate their receipt of the Nobel Prize in Economics for 2011.

Sustainable China

As many of you know, Lawrence received a grant from the Luce Foundation to explore a program we call Sustainable China: Integrating Culture, Conservation, and Commerce.  Thursday and Friday we will be hosting two visitors from the Karst Institute at Guizhou Normal University in Guiyang, China.  They will be giving a  talk on Friday afternoon at 3:10 in Steitz 102 and are available for Q & A after the talk.  Please below for details or green posters in various spots in Briggs Hall.

Sustainable China:  Integrating Culture, Conservation and Commerce

~~~~~~~~~~~~~~~~~~~~~~~~~~

Ren Xiaodong

Professor at the Institute of South China Karst and Director of the Community-Based Conservation and Research Development Center at

Guizhou Normal University

“Integrated Management of Nature Reserves in Guizhou Province”

Professor Ren will discuss efforts to incorporate a variety of stakeholders in the management of the Chishui Nature Reserve.  The reserve is a national treasure as well as the source of water for the Moutai Liquor.

Zhou Zongfa

Vice Dean Institute of South China Karst and Professor in School of Geography and Biological Science at Guizhou Normal University

“Use of Geographic Information Systems (GIS) for the study of Karst and Caves in Guizhou Province”

Professor Zhou will address how GIS systems help identify the characteristics of sedimentary rocks in China which will assist decision-makers in evaluating the effects of and planning for future economic development in Guizhou Province.

~~~~~~~~~~~~~~~~~~~~~~~~~~

Friday, September 30th

3:10pm

Steitz Hall 102

Excessive Monetary Easing is Part of the Problem

If short term interest rates drop from .1% to .02% does it generate more economic activity?  If long term rates drop from 3% to 2% (or even 1.7% as with 10 year US Treasury Notes), will people want to borrow more given the current economic environment?  Most readers know my pessimism regarding answers to these questions.  The IMF, in its latest global financial stability report, makes the case quite strongly.  Furthermore, as argued previously and by most “Austrians” since Mises and Hayek, overly cheap capital causes a great deal of mis-allocation of capital.  The Financial Times editorial today summarizes the IMF report.

The IMF’s latest global financial stability report says rightly enough that the eurozone crisis, and the row over the US debt ceiling, sparked an increase in risk aversion. But the IMF worries that exceptionally low interest rates are building a fresh credit problem. They have spurred a hunt for yield which, as widely broadcast, has sent too much capital to emerging markets. When capital is too cheap, it is mis-allocated.

The FT editorial concludes:

Either credit markets see reasons for economic cheer that have eluded everyone else, or low interest rates have sparked another round of irresponsible lending.

The Health Care Arms Race

Are you a fan of Dr. Seuss?  If so, you must see this new video on health care costs done in the style of the good doctor.  If not, watch it anyway.  It displays what happens when supply drives demand, and demand is fueled by third party funding.  Yes, those of you in Money and Monetary Policy will recognize the OPM principle at work:  people spend Other People’s Money much differently than they do their own.  Another principle is also involved.  The creation of jobs for jobs sake is not sustainable.  “Oh, The Jobs You Create” becomes “Oh, The Debt You Create.”  Enjoy.

Harry Kraemer’s Visit

I hope that all of you are planning to attend Harry Kraemer’s matriculation convocation address on values and leadership, which takes place at 11:10 on Thursday in the chapel.   Prior to his convo address, Kraemer will be coming to my Money and Monetary Policy course to talk about his view of the state of the US economy.  This will take place at 10 AM in Briggs Hall 225 (or possibly 224) .  All are welcome to join.