Lawrence Economics Blog

Creative Instruction

Unsustainable Indoor Gardening?

As I gear up for (count ’em) two environmental studies courses next term, I turn to Mother Jones for inspiration.  And she delivers an extraordinary feature article on the environmental and energy implications of marijuana production.  I can’t speak to the merits or accuracy of the article’s contentions, but I was struck by this bewildering assertion:


My guess is that, like most crop farming, marijuana cultivation would use a lot less energy per unit output if it was grown at scale.  Indeed, it’s kind of hard to imagine that any indoor growing would be efficient at $0.15 kWh. 

Even so, nine percent of electricity use seems incredibly high.  

Is that Love in the Air?

Back in 2003, the combination of heat and bad air quality in Paris got so bad that it claimed the lives of an estimated 10,000 people.

That was one nasty wave of heat and pollution.

It seems that something other than love is in the air once again, and things have gotten so bad that Paris officials banned all cars with even numbered license plates this past Monday.  The reason is the shockingly high levels of particulate matter concentration (PM).  PM is a “criteria” pollutant regulated by the EPA, and it is linked to possibly several hundred thousand premature deaths each year.  In the US, however, the dominant source of emissions is coal-fired power plants, whereas the EU has a much bigger share of its passenger vehicles powered by diesel fuel.  These diesel vehicles are much greater contributor to PM than the gasoline-powered vehicles common in the US.

From the AP story:

The safe limit for PM10 is set at 80 microgrammes per cubic metre (mcg/m3). At its peak last week, Paris hit a high of 180 mcg/m3 but this had fallen to 75 mcg/m3 by Monday.

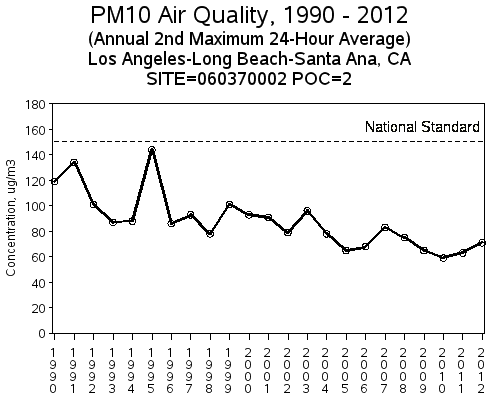
I suppose the fact that it fell to 75 mcg/m3 is comforting, but that is still very high.  As a basis for comparison, I picked a monitoring station from Los Angeles –one of the heaviest polluted urban areas in the US.  The data are available at the EPA air trends site, which tracks every monitoring station.

LA PM

Notice that the standard is the second-highest average for a 24-hour period, with the U.S. standard at 150.  Also notice that the 75 mg/m3 that Paris returned to is still about as bad as it gets down in LA these days.

NCAA Pick$

Slate has an ingenious interactive tool that fills in your NCAA bracket based on various criteria, including the schools’ academic rankings, distance to the area (nearer team wins), SAT scores (higher winning, inexplicably), and my personal favorite, dog friendliness.

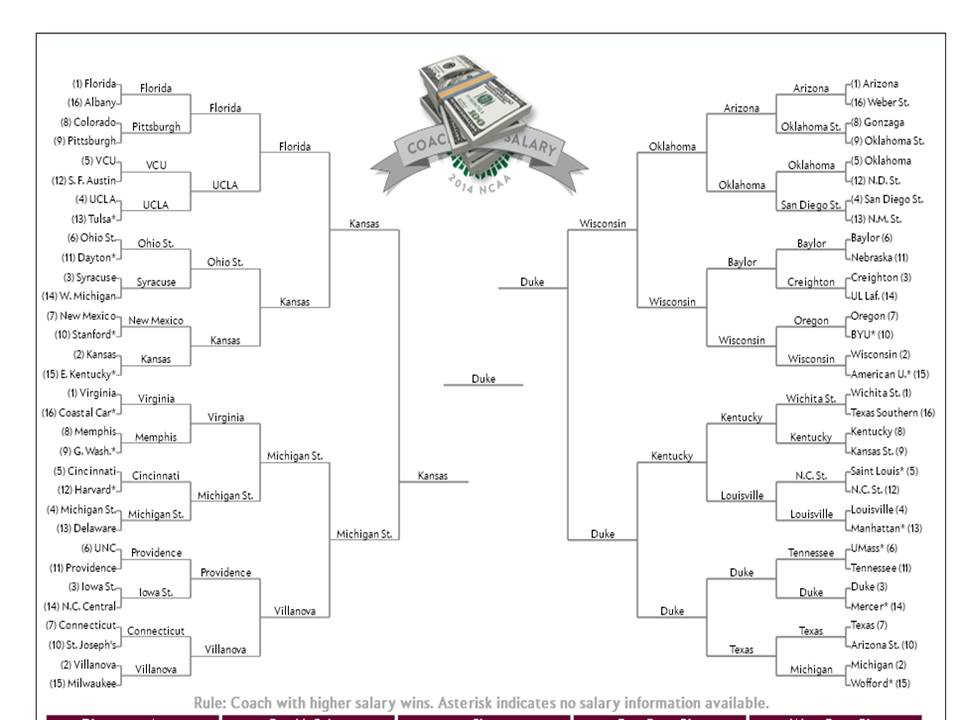
But, as market economists, perhaps we should just let the market speak by looking at the most handsomely paid coaches!    Slate Picks

As you may know, the highest-paid state employee in most states is the head football coach at one of the public universities.  Here in Wisconsin, however, Madison’s coach Bo Ryan has that distinction, which is good enough for the highest-paid coach in that region.  I’m guessing that Michigan State University coach Tom Izzo is the highest-paid employee in Michigan. 

Not surprisingly, these look a lot like many of the actual “expert” picks for much of the tournament, including Michigan State reaching the Final Four as a four seed.

Although I like the idea of picking based on coach salary — what better measure of quality than willingness to pay for a coach?! — one suspects we can actually measure performance, so I tend to lean on the Logistic Regression Markov Chain model to inform my picks.

How Sensitive Are You?

The Washington Post gives us a fascinating glimpse into the choice of the economics major (is there anything about economics that’s not fascinating?).

Executive Summary:  Women are more grade sensitive than men.

econ dropoff gradiant by men v women

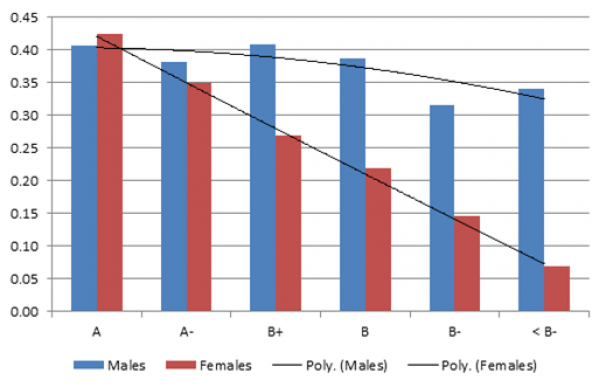
The data are from an “anonymous research institution” and the relationship of interest is the choice of the economics major based on the grade in the introductory economics class.  For students getting As, for example, about 40% of males and between 40 and 45% of females go on to major in economics.  For males, that’s pretty much true whatever grade they get, but females appear to be far more responsive to lower grades.  The starkest comparison is for the A and the B+ students.  Approximately 40% of male students who get an A or B+ become majors, whereas for females there appears to be about a 30% dropoff in the probability of becoming a major as the grade goes from an A to a B+.  The interpretation is that women are more grade sensitive than men, and as a result move on to a different discipline, where presumably their grades are likely to be higher.

Here’s Harvard’s Claudia Goldin:

“Maybe women just don’t want to get things wrong,” Goldin hypothesized. “They don’t want to walk around being a B-minus student in something. They want to find something they can be an A student in. They want something where the professor will pat them on the back and say ‘You’re doing so well!’ ”

“Guys,” she added, “don’t seem to give two damns.”

I wonder what percentage of men and women go into an economics class with the idea that they are going to major in the subject?  One possibility is that more men plan to go into economics, and are less discouraged by a “low” grade. Notice that overall, between 30 and 40% of men who take that class wind up as majors.  We also know that men account for just over 70% of majors.  So if we assume an equal split of men and women in going into an intro class of 100 people at the school where the data were collected, we might expect 17.5 men and 7.5 women to wind up as majors. 

Incidentally, I looked at the past several years of data and 35% of our graduating seniors have been women, which is a solid 20% higher than the national average of 29%.

A Principled Agent?

As I wrapped up Econ 450 today, I told the class that the basic theoretical frameworks, including agency theory, should continue to pop up for as long as we both shall live.  And here, from Wired, we have an agent (allegedly) trying to bilk the principal.   The players should be familiar.

The Obama administration accused Sprint today of overcharging the government more than $21 million in wiretapping expenses…

Sprint… inflated charges approximately 58 percent between 2007 and 2010, according to a lawsuit the administration brought against the carrier today.

The Agent says it was just doing what it was told:

Under the law, the government is required to reimburse Sprint for its reasonable costs incurred when assisting law enforcement agencies with electronic surveillance,” Sprint spokesman John Taylor said. “The invoices Sprint has submitted to the government fully comply with the law. We have fully cooperated with this investigation and intend to defend this matter vigorously.”

It seems that the Principal gave the Agent plenty of opportunities:

According to records, the number of domestic federal and state wiretaps reported in 2012 increased 24 percent from the year earlier. Overall, a total of 3,395 wiretaps were reported in 2012. Of those, 1,354 were authorized by federal judges, and 2,041 by state judges. The number of federal orders jumped 71 percent. State orders increased 5 percent.

102 Days and the LU Curling Club

Curling
Click for a bigger Spiel

This past week President Burstein hosted a pizza gathering in anticipation of the annual 102-Day Senior Party.  As the name indicates, the party marks only 102 days until Commencement for our out-going Seniors, assuming their Senior Experience papers get whipped into shape.

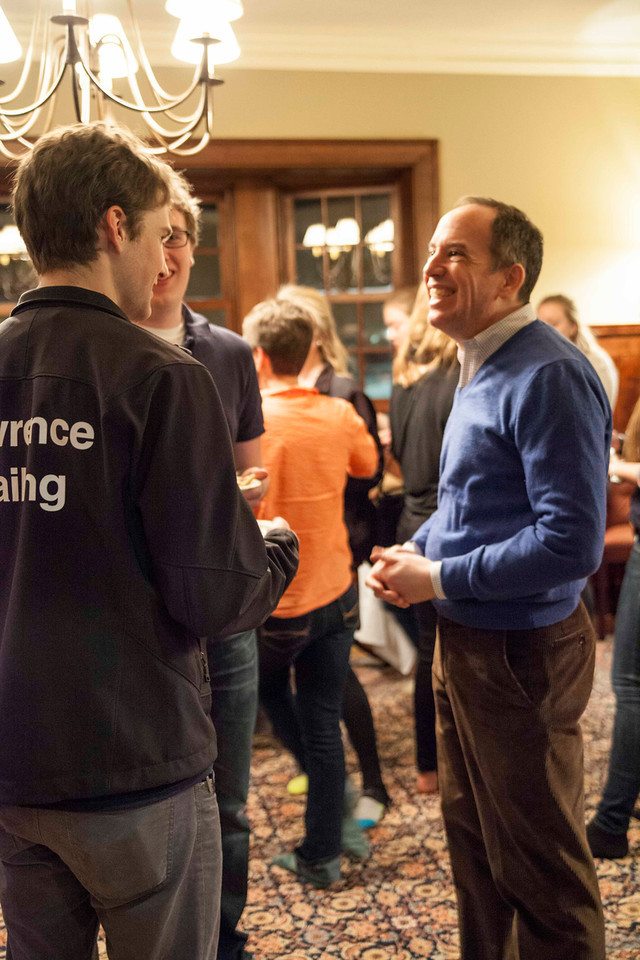
Though I was not able to attend (invitation lost, perhaps?), I see that the President’s gathering included some charter members of the Lawrence Curling Club, of which I am the faculty sponsor.  Pictured is the president with some of our young curlers, who are no doubt explaining that “take out” is not pizza related, nor does “hog line” have to do with diners queuing for sausage pizza.

More Light?!?

I am one of the contributors to the New York Times Room for Debate section today on Daylight Saving Time.  My contribution has to do with the changes in pedestrian fatality risks and total fatalities associated with the time change. (UPDATE:  There is also a piece up in the Sunday Appleton Post-Crescent).

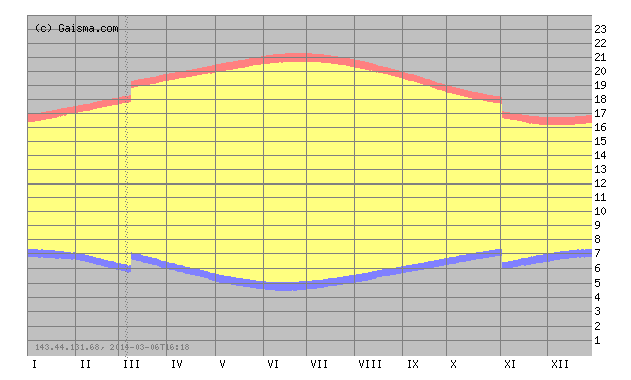
So, what does a time change look like?  Glad you asked:  The figure from the sunshine authority, Gaisma.com, shows daylight patterns for our own Appleton, Wisconsin.  Each day starts with midnight at the bottom and goes to the top, and the months go left to right.  The blue line is the dawn and the red the dusk.

The Appleton Day
Appleton Time

The switch to DST in March and the switch back to standard time in November are clear — they are the discontinuities (the “breaks”) in the sunrise and sunset curves.  Because we “spring ahead” one hour, the sunrise time on Sunday morning will be one hour later than it was on Saturday.  An early morning walk that was in that daylight on Saturday will be in the dark on Sunday.  To have a sunrise at the same time as Saturday’s, we will have to wait until early April.  The opposite happens in the evening.  Sunset will be one hour later starting on Sunday.  There will be less light in the morning, but more light in the evening.

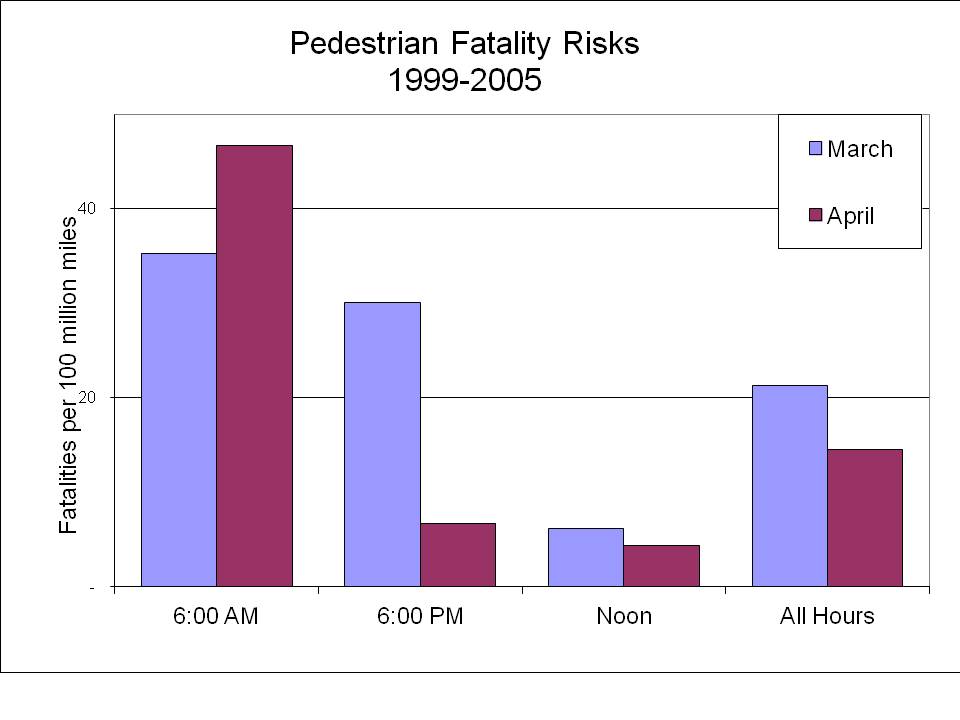
Light and visibility are extremely important determinants of traffic safety, particularly for pedestrians.  Paul Fischbeck and I looked at data from 1999-2005 on fatalities and travel patterns, and determined that the morning risk increases about 30% per mile walked, while the afternoon risk falls close to 80%.

The figure below shows pedestrian fatality risks from 1999-2005.  The blue and maroon bars show fatality risks per 100 million miles walked in March and April, respectively.  Note that for the 6 a.m. time slot the risks increase about 30%, whereas for the 6 p.m. time slot the risks take a sharp nosedive.  At midday the risks stay right about the same (we found no statistically significant difference in risks for that time period).  Overall, total pedestrian fatalities decrease in the Spring both because risks fall more in the evening than they rise in the morning, and there are many more people out later in the day.

Ped Spring

These data are rather crude in the presentation, as they do not focus specifically on the days leading up to and immediately following the time shifts, which is how researchers typically isolate the effects of the time change.

Here are some references for those interested:

S A Ferguson, D F Preusser, A K Lund, P L Zador, and R G Ulmer “Daylight saving time and motor vehicle crashes: the reduction in pedestrian and vehicle occupant fatalities,” American Journal of Public Health 1995 85:1, 92-95

J M Sullivan and M J Flannagan, “The role of ambient light level in fatal crashes: inferences from daylight saving time transitions,” Accident Analysis & Prevention, 2002 34:4, 487-498

D Coate and S Markowitz, “The effects of daylight and daylight saving time on US pedestrian fatalities and motor vehicle occupant fatalities,” Accident Analysis & Prevention, 2004, 36: 3 351-357


Again?

The Wall Street Journal reports that “Corporate Economists Are Hot Again.”

This:

With more data available than ever before and markets increasingly unpredictable, U.S. companies—from manufacturers to banks and pharmaceutical companies—are expanding their corporate economist staffs. The number of private-sector economists surged 57% to 8,680 in 2012 from 5,510 in 2009, according to the Bureau of Labor Statistics. In 2012, Wells Fargo had one economist in its corporate economics department. Now, it has six.

And this:

The key to the revival of in-house economists, companies and economists say, is the need to digest huge amounts of data—from production volumes in overseas markets to laptop usage in urban areas—to determine opportunities and risks for companies’ business units, not just in the U.S. but around the world.

As those of you who read this blog probably already know, we think that life as an economist is pretty awesome.  And it’s not just us saying it, either.  Here’s Noah Smith from the Noahpinion blog who says it thusly:

People often ask me: “Noah, what career path can I take where I’m virtually guaranteed to get a well-paying job in my field of interest, which doesn’t force me to work 80 hours a week, and which gives me both autonomy and intellectual excitement?” Well, actually, I lied, no one asks me that. But they should ask me that, because I do know of such a  career path, and it’s called the economics PhD.

“What?!!”, you sputter. “What about all those articles telling me never, ever, never, never to get a PhD?! Didn’t you read those?! Don’t you know that PhDs are proliferating  like mushrooms even as tenure-track jobs disappear? Do you want us to be stuck in eternal postdoc hell, or turn into adjunct-faculty wage-slaves?!”

To which I respond: There are PhDs, and there are PhDs, and then there are econ PhDs.

The emphasis is mine and I scrubbed the links, but the sentiment remains.  A highly recommended read for the thinking-about-a-Ph.D. set.

Calculating a GPA

Have you ever wondered how to calculate your grade point average?  If so, boy have you come to the right blog post.

Here’s what you need to do:  Take your Grade in a given course and assign it the number of Points for that grade (e.g., an A is 4 points, A- 3.75 points, B+ 3.25 points, etc).*

Once you’ve taken care of that, multiply the number of Points by the number of Earned Units for that course.  So, for example, if you earn an A in a six-unit course, your total quantity of points (Qty Points) would be 4 points for an A times 6 Earned Units = 24.  

Now you can add up your total Qty Points and divide by GPA Units and, wah lah, you have your Grade Point Average. 

As example, you take four courses in your first term, get a B in Freshman Studies, a B+ in Geology, and an S in Economics because you S/Ued the course, an a B in a one-unit piano performance course.  Your grade point average would only include courses with grades and would be calculated thusly:

(3 points x 6 units + 3.25 points x 6 units + 3 points x 1 unit) / 13 units = 3.12

 And if you’d like an Excel spreadsheet that does it for you, here it is (email Professor Galambos with comments or questions about the spreadsheet).

* A full list of Grade Points can be found here


Interdisciplinary Area in Innovation and Entrepreneurship

Over the past six years, a group of Lawrence faculty members have developed several courses and course modules in innovation and entrepreneurship. By now, several hundred Lawrence students have taken those courses. The Lawrence faculty has now voted to create a formal academic program in innovation and entrepreneurship: the Interdisciplinary Area in I&E. Students from all majors with an interest in innovation or entrepreneurship are invited to explore the new IA. The rest of this post gives a general idea of the new IA. Look for more details on the I&E website in the near future. Continue reading Interdisciplinary Area in Innovation and Entrepreneurship

Spring Term Courses

Though Spring does not appear to be right around the corner, the Spring Term is closer than you think!  Here are some of the highlights from Economics for the Spring Term.

ECON 495: Individual and Community  TR 12:30-2:20 in the Econ Seminar Room, Professor Wulf.

Professor Steve Wulf (!) is cross-listing his fabulous course for the economics department for the first time. That being the case, here is the course description:  This course studies a variety of theoretical responses to the emergence of open societies in the West. Topics include the competing demands of individuality and community in religious, commercial, and political life.   The course promises a very healthy dose of history of economic thought.

ECON 460:  International Trade   MWF 8:30-9:40 in the Econ Seminar Room, Professor Devkota.

ECON 405:  Innovation and Entrepreneurship  9:50-11:00 MWF in the Econ Seminar Room, Professor Galambos.

For those of you looking for some theoretical foundations to thinking about innovation & entrepreneurship, look no farther.  An excellent complement to IO and Theory of the Firm.

ECON 320:  Intermediate Macroeconomics MTWR Briggs 223.

Always a highlight!

ECON 295:  Labor Economics 3:10-4:20 MWF in the Econ Seminar Room, Professor Rhodes

If you are looking for a 200-level economics course next term, this is a good bet.  This should be excellent prep for Econ 300 in the Fall.

ECON 200: Development Economics 11:10-12:20 MWF in the Econ Seminar Room, Professor Devkota 

This is also a good bet for next term, especially for those interested in understanding economic growth across countries.

ECON 225:  Decision Theory  MWF 1:50-3:00 Briggs 223, Professor Galambos

This class is not full, but enrollment is heavy (30+).  We have committed to offering this in 2014-15 and expect it will be offered in 2015-16.

ECON 280:  Environmental Economics TR 12:30-2:20, Briggs 223, Professor Gerard

This class is full and the current wait list is 9.  It is offered each year, including Spring 2015.

ECON 120:  Introduction to Macroeconomics  MWF 12:30-1:40, Briggs 223, Professor Rhodes

The longest journey begins with the first step… and then the second step.  This could go either way, as ECON 100 is not a prerequisite.

“Big” Economics Colloquium, March 6

Scraping Data and Making “Big” Inferences

Arnold F. Shober
Lawrence University

Abstract: “Big Data” does little to explain the human condition, but it offers unprecedented opportunities to model how people choose.  Professor Shober will describe how Google and Amazon know what you want with uncanny accuracy, and how in his research program he uses similar tools to examine how journalists cover politicians.  He will also discuss some of the practical and statistical difficulties when analyzing billions of data points.

The talk is March 6 at 11:10 a.m. in Steitz Hall 102.


UPDATE:  A very good talk.  Unfortunately, we did not get video for his one.

The Answer is a Carbon Tax. What’s the Question?

GERARD HandA few weeks ago I gave a talk at the weekly Greenfire meeting and the Lawrentian had a very nice summation of its intent and content.   I will point out one area where I think the reporter seems to have misunderstood my intent:

He spent much of the presentation promoting CCS [carbon capture and sequestration] as “the critical enabling technology that would reduce emissions,” and supporting a carbon tax.

I did spend quite a bit of time talking about CCS,  but I don’t think I was promoting it.  My conclusion is this:

I conclude that not only is CCS not likely to be implemented, but that the future of U.S. coal itself is in serious question. The idea that any coal plants equipped with CCS and financed with private sector capital will be built is pretty much unthinkable at this point.

I suppose I could believe the above statement and still think that CCS is a great idea, but I’m not sure that I ever felt strongly enough about it to “promote it.”  Although coal plants have pretty low operating costs, they are extremely capital intensive. The plants we were looking at had about a 40% premium for adding the CCS component. Moreover,the external costs are very high, even with CCS. In many ways I would say the same about mandated fuel efficiency (i.e., the CAFE standards),  where I can see a reasonable case to be made to go that route, but I wouldn’t go that route if I didn’t have to.

One thing I do continue to promote is the idea of a tax as a means to reduce energy use, specifically with respect to the otherwise “unpriced” external costs.  This is from a paper I co-authored ten years ago about U.S. fuel efficiency standards:

For a fleet that averages 17 to 20 MPG, the appropriate tax for an external cost of eight to 10-cents per mile would be in the range of $1.36 to $ 2.00 per gallon. This needed increase in the gas tax is the most important implication that can be drawn from the recent criticisms of the CAFE program – current costs of highway injuries and deaths, congestion, and air pollution are enormous and require a dramatic public policy response. Raising the gas tax by $1.36 to $2.00 would induce a sharp reduction in vehicle miles traveled and encourage consumers to demand fuel-economy improvements in new vehicles.

And we weren’t alone.

Not surprisingly, I have pretty much the same views about reducing carbon emissions — a tax on carbon emissions is the way to go.   This is a proposal that has much in the way of potential benefits  and has near-unanimous support across the economics profession. (!)

Although many people think economists are a wacky, impractical bunch, in this case there are some governments paying attention.  In particular, Australia implemented a carbon tax not terribly long ago, and the results are as encouraging as they are predictable.

Australia’s greenhouse gas emissions from the electricity sector are down about 7.6 per cent since the carbon tax was introduced in July 2012…  Emissions from the power sector have been dropping, particularly since the introduction of a $23 a tonne price on carbon in mid-2012, making renewable energy supplies more attractive. Demand for electricity has also been dropping as manufacturing shrinks and energy efficiency efforts take hold.

I guess all of that is a positive, minus the manufacturing shrinking part.  Though, if the value of the manufactured products don’t warrant high enough prices to cover the social costs of carbon, then that displacement is a textbook case of scaling back on overproduction of “bads”.

If I won the lottery I would …

… become more conservative and less egalitarian?

Wait, that’s not how this game goes.   You ask me about what I would do if I won the lottery and I tell you about giving generously to good causes or living large in the tropics or indulging in any number of real or imagined decadent behaviors only available to the 1%.  Is there anyone who doesn’t daydream about winning the lottery? 

Andrew Oswald and Nattavudh Powdthavee think that is all fine and good, but they measure some behavioral effects of very modest British lottery winners (less than $500,000) and have these money points for us:

We find that the larger is their lottery win, the greater is that person’s subsequent tendency, after controlling for other influences, to switch their political views from left to right.

Specifically, they find that for the bigger winners, about 20% who did not vote conservative prior to winning the lottery began to vote conservative after the win. And as for the “greedy”:

We also provide evidence that lottery winners are more sympathetic to the belief that ordinary people ‘already get a fair share of society’s wealth’.

So, next time someone asks you what you would do if you won the lottery, tell them you will probably become greedier and more conservative.

We’re #22!

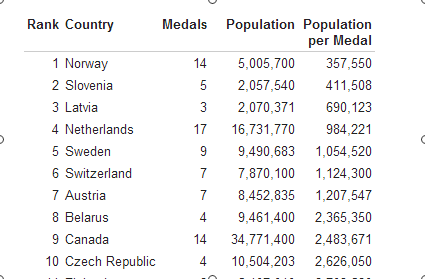
MedalsEvery two years sportscasters around the nation and around the world keep track of Olympic glory by reporting the medal count.  Currently, the Netherlands leads the pack with 17 medals, with the U.S. and Russian Federation close behind at 16.

But is that really a fair comparison?  The U.S. has almost 20 times as many people as the Netherlands and therefore 20 times more citizens who could potentially excel in dancing on ice, skeet shooting, curling, or bandying (?).   It would be like measuring economic development by total GDP rather than per-capita GDP (wait, we do that, too).

That’s why it’s refreshing that the good folks at www.medalspercapita.com are keeping it real for us, taking the total medal count and dividing by the population. “Olympic Glory in Proportion” is their motto, and I couldn’t agree more.

With that adjustment, tiny Norway with just 5 million people (fewer people than in Wisconsin!) is in the lead, with the Netherlands falling to fourth.   Slovenia, with a mere two million people, has racked up five medals and is in the second spot.  The U.S. is a distant 22nd place.  Owie. 

They also weight medals based per dollar of GDP, which really shakes things up.  With this adjustment, Latvia, Slovenia, and Belarus are completely dusting the competition.

In case anyone was wondering, Hungary has yet to medal in these Olympics, so the per capita adjustment doesn’t do much in this case.  Indeed, the proud Hungarian nation hasn’t had a medal in the Winter Games since the indomitable Krisztina Regőczy and András Sallay took silver in the ice dancing back in 1980.

I guess since it was a silver medal they were somewhat domitable.

Next Economics Colloquium, February 20

Health Care:  It Took Years to Build Up this Much Duct Tape

Travis Andersen
President, St. Elizabeth Hospital


Mr. Andersen will provide an overview of the U.S. health care system, including a brief history of the emergence of our current system, and where the system stands in terms of the implementation of the Patient Protection and Affordable Care Act.  He will also discuss the emergent role of integrated-delivery systems, and how these systems shape provider incentives in terms of costs and quality, and the anticipated effects for patient outcomes. 


February 20
4:30 p.m.
Steitz Hall 102

Abominable, That Is

Abominable
Gosh it’s hot

The Greenfire Speaker Series has enlisted me to talk a bit about my work.  So it is with this much fanfare that I announce that I will be giving a talk on U.S. electricity, carbon emissions, and global climate change:

Is it Warm in Here?  The Great World Carbon Belch and Why It Is Probably Going to Get Worse

The talk is 8:30 p.m. in Sabin House and I guess everyone is welcome (Greenfire circulated some pretty cool posters).

Here’s a taste here, and the talk will draw heavily on these sources:

Paul S. Fischbeck, David Gerard, and Sean T. McCoy (2012), Sensitivity analysis of the build decision for carbon capture and sequestration projects. Greenhouse Gas Sci Technol, 2: 36–45. Available at http://onlinelibrary.wiley.com/doi/10.1002/ghg.1270/full

M. Granger Morgan et al., (2012) Carbon Capture and Sequestration: Removing the Legal and Regulatory Barriers, Reources for the Future Press. (I have a copy!)

William Nordhaus (2013) The Climate Casino: Risk, Uncertainty, and Economics for a Warming World.  Yale University Press.

Severin Borenstein, (2012) “The Private and Public Economics of Renewable Electricity Generation,” Journal of Economic Perspectives, 26(1):67-92. Available at: http://www.aeaweb.org/articles.php?doi=10.1257/jep.26.1.67

Michael Greenstone and Adam Looney. “Paying Too Much for Energy? The True Costs of Our Energy Choices.” Daedalus 141.2 (2012): 10-30.  Available at: http://web.mit.edu/ceepr/www/publications/workingpapers/2012-002.pdf

BBC News, “At a Glance, The Stern Review,” Available here: http://news.bbc.co.uk/2/hi/business/6098362.stm

Click on the picture for six minutes of relatively carbon-free awesomeness.

The Greatest Period in World History

Morgan Housel at The Motley Fool lists the 50 reasons we’re living through the greatest period in world history (free registration may be required), and here are the first three (for the rest see here):

1. U.S. life expectancy at birth was 39 years in 1800, 49 years in 1900, 68 years in 1950, and 79 years today. The average newborn today can expect to live an entire generation longer than his great-grandparents could.

2. In 1949, Popular Mechanics magazine made the bold prediction that someday a computer could weigh less than 1 ton. I wrote this sentence on an iPad that weighs 0.73 pounds.

3. The average American now retires at age 62. One hundred years ago, the average American died at age 51. Enjoy your golden years — your ancestors didn’t get any of them.

See Louis CK talk about “Everything’s amazing and nobody’s happy

Economics Colloquium, Monday at 4:30

Jonathan Lhost, a Ph.D. candidate at the University of Texas, will visit campus Monday and deliver the next edition of the Economics Colloquium.  The talk will be at 4:30 Monday in Steitz 102.

You can take a look at the paper (see below) and be sure to bring your computer so you can follow along with the interactive appendix.

Credit or Debit? How Surcharging Affects Customers, Merchants, and the Platform

Jonathan Lhost
University of Texas


ABSTRACT:  Payment cards were used to complete over 87 billion transactions in the United States in 2012, worth over $4 trillion. The cost for merchants of these transactions is significant, with merchants paying over $66 billion in fees to payment card networks (e.g., Visa) in 2012, and also varies widely based on the type of payment card used, with credit cards often twice as costly for merchants as debit cards. Historically, with limited exceptions, merchants have been prohibited, both by law and by the contract permitting the acceptance of that network’s cards, from what is known as “surcharging,” that is, charging a customer a higher or lower price depending upon the cost to the merchant of the customer’s payment method. Merchants have raised legal challenges against this prohibition on surcharging, claiming it is anti-competitive, increases their costs, and reduces their profits. Recent concessions made by several major payment networks in response to these legal challenges raises the possibility that this paradigm might change in the future.


I consider a population of customers who have different valuations for a good sold by two competing merchants, as well as varying preferences over the merchant from which to purchase the good and the payment form with which to make the purchase, and examine what the effects might be if merchants were allowed to surcharge. When the merchants have identical marginal costs, both merchants have higher profits when allowed to surcharge. However, if merchants are asymmetric, the merchant with lower costs, typically a larger retailer, benefits from surcharging, whereas the merchant without an ability to reduce costs, typically a smaller retailer, does not.


Some Trivial Matters

Congratulations to Addison Goldberg and Steve Wasilczuk for their stints as trivia Grand Master and trivia Grand Master’s sidekick, respectively, for this year’s edition of the Lawrence trivia weekend.  These two were in my Freshman Studies class once upon a time, and I still have some documentation from that class to share with them upon graduation.

But for now, I would simply like to share some tips on cooking bacon from the folks at www.thekitchn.com.  First up, here they advise us to just add a little water to the pan. The water separates the fat from the bacon (that is, it renders it) and keeps the fat from splattering.  Here’s all you need to know:

Once the bacon is in the pan, add just enough water to completely coat the bottom of the pan and cook over medium-high heat until the water has evaporated. Reduce the heat to medium and cook the bacon until crisp.

For higher-volumes of bacon, however, I recommend that you forego the stove top altogether and put the bacon into the oven.   It doesn’t get any easier than this: cover a cookie sheet with tin foil, put the strips on top, pop it in the oven at 400F, and 15 minutes later the deed is done.

Once again, congratulations to this year’s trivia masters, and we’ll see you back here next year for the 50th.

And here’s the Lawrence Minute!