David Gerard

Author: David Gerard

Be Careful What You Ask For

Have you heard the one about the Frenchman who asked for higher taxes on himself?

A little over a year ago, some of the most prominent and wealthy executives in France signed a petition seeking higher taxes on themselves. Yes, higher taxes…

You may know what happened next: François Hollande, the country’s socialist president, proposed a 75 percent marginal tax rate on all income over $1.3 million. (The highest marginal tax rate on the first $1.3 million would be 45 percent, up from 41 percent.) Marginal tax rates on capital gains would rise to as much as about 60 percent.

Now many of the nation’s wealthiest executives — including some who signed the original petition — and entrepreneurs, private equity managers and others who are millionaires, or want to become millionaires, are crying foul. In a sign that executives are moving, or threatening to move, to lower-taxed countries, high-end real estate in Paris is being thrown on the market.

Another post that would seem to speak for itself, except for this:

The purpose of the tax is more populist than mathematical: the marginal income tax increase is estimated to raise only about $300 million.

To give that some perspective, France’s budget deficit last year was on the order of $150 billion, so $300 million is equivalent to about 0.2% of the shortfall.

Better Late than Never, I Say

But why are economists, once thought to be humorless practitioners of the “dismal science” suddenly becoming celebrities? Since when did they become gurus to whom ordinary people can turn to for everyday-life advice?

That’s from “Rise of the Celebrity Economist,” at Salon.com.

If you have to ask why, then my guess is that you aren’t going to get a very flattering portrait.

Predict the Economics Nobel Prize

UPDATE: Professor Gerard picks Paul Romer,  Professor Finkler picks Romer and William Baumol (both at Stern!), Professor Galambos still undecided, see comments for additional picks.

Anxiously Awaiting the Announcement

The 2012 Nobel Prize in Economic Sciences will be announced on Monday 15 October, and once again all the world is riveted in anticipation. The riveted parties include those residing on Briggs 2nd, where we will once again sponsor a Predict the Nobel Prize Contest, with the winner to take home some fabulous prizes.

I don’t see any formal odds online yet, but Thomson Reuters provides some thoughts on Steven Ross for arbitrage pricing theory, Robert Schiller for work on market volatility, and Anthony Atkinson & Angus Deaton for the famous Atkinson & Deaton work on income, consumption, and well-being.

So, submit your pick to Prof Gerard prior to October 15, keeping in mind that the Nobel winner will not necessarily come from that draw (Of course, I’m still partial to Armen Alchian, and I have to believe Jerry Hausman will win sooner or later).  You can also post them in the comments, first come, first serve.


For further reading:

Robert J. Shiller 2003. “From Efficient Markets Theory to Behavioral Finance,” Journal of Economic Perspectives, 17(1): 83–104.

Stephen A.  Ross, 2004 “Review of The New Financial Order by Shiller,” Journal of Economic Literature, 42(4): 1098–1101.

Angus Deaton 2008. “Income, Health, and Well-Being around the World: Evidence from the Gallup World Poll,” Journal of Economic Perspectives, 22(2): 53–72.


The Chicken Dance is a Grim Trigger

The Sheboygan Press reports on a recent showdown at the Sheboygan North High School Homecoming dance.  It seems the jubilant student dancers broke out some moves that strayed a bit too far to the salacious side, prompting Principal Jason “Takes No” Bull to issue this dictum:

[Bull announced] that if inappropriate behavior were to continue, the lights would stay on, the chicken dance song would be played for the rest of the night, and/or the dance would be canceled.

The grim trigger is a strategy in a non-cooperative game, where one party threatens to end cooperation forever if the other party fails to cooperate.  Evidently, it was a credible threat.

Perhaps this helps to explain why.

The Morality of Markets

Here is our schedule for the term:

October 4th 11:10–12:20       Ethics, Efficiency, and Markets, up to page 103

October 25th 11:10–12:20            What Money Can’t Buy, Chapter 1

November 1st 11:10–12:20      What Money Can’t Buy, Chapter 2

November 8th 11:10–12:20      What Money Can’t Buy, Chapter 3

November 15th 11:10–12:20     What Money Can’t Buy, Chapters 4, 5.

The reading for the first meeting  (10/4)  is 100 pages, and for subsequent meetings it is about 50 pages each. The first reading, Ethics, Efficiency, and Markets, is available for purchase as an online book, you can order used copies, or you can download it from this website: http://en.bookfi.org/book/1172337. The first chapter in that book is a short introduction in which basic notions are established; Chapter 2 will review several arguments that you will be familiar with from your economics classes; and Chapter 3 is the most significant for our discussion. Be prepared to state succinctly the moral arguments for and against the market. You have over two weeks to cover the 100 pages, which should not be too taxing. This first reading should give us some ammunition for our discussions of the second book.

People, It is a Commodities Boom

If you didn’t know already, the U.S. and many other parts of the world are amidst an epic energy boom that has sent natural gas prices tumbling.  One back-of-the envelope calculation suggests that consumers have benefited to the tune of more than $100 billion (that’s a lot); another suggests it’s more like $300 billion annually (that’s even more).

So, with that in mind, which group of graduates on average do you think earned a higher starting salary last year — those from Harvard University or those from the South Dakota School of Mines & Technology?

Answer here, if you haven’t already guessed.

Plenty more at Mark Perry’s blog.

Let Me Guess — Your PIN is 1234, right?

As easy as 1234… Or 2580!

If a random sample of the population is reading this post, then more than 10% of you are saying “why, yes. Yes it is!”

What about the other 90% of you?  Hmmm, let me see here — How about 1111? 0000? 1212? 7777?

Those next four numbers should account for another 10% of you, so those five account for one in every five (20%) of all four-digit passwords. That is, the numbers that protect your savings and checking accounts, among other things, from would-be interlopers.

Jeepers.

It turns out that only 426 codes account for more than half of all passwords. If passwords were distributed randomly, it would take 5,000, of course. So someone who nicks your debit card has a pretty good chance of cracking your code just by going through a list of “easy to remember” numbers.

How do I know all of this?

The crew over at the Data Genetics blog got a hold of 3.4 million passwords from breached databases, and took a look at the frequency of various numbers in a mind-boggling array of ways. Very cool post.  And, for most of you, probably time to change your password.

For those 0.000744% of you with 8068 — the least common password — it’s probably time to change your password, too.  Once people see that it is the least common, they will pick it and it wont be least common any more. Oh, 2727.

2580 comes in at #22.  Can you see why?

Professor, What’s Another Name for Pirate Treasure?

It’s Talk Like a Pirate Day, and here’s my annual plug to visit The Mudd’s witty homepage — more than a laugh a minute — and also to check out Peter Leeson’s excellent work s on piratical organization, The Invisible Hook.
Here’s the gist:

The idea of the invisible hook is that pirates, though they’re criminals, are still driven by their self-interest. So they were driven to build systems of government and social structures that allowed them to better pursue their criminal ends

If you don’t have time to read the whole book today, you can read one of the many favorable reviews instead.   For the more scholarly version, check out Leeson’s original Journal of Political Economy piece.

Playing the Percentiles

You are likely to be many, many discussions about income inequality, redistribution, and the state of the “middle class” in the coming months.  There was all sorts of hubbub last week when presidential candidate Mitt Romney said that families making between $200,00 and $250,000 were part of the middle class.

Could Romney be correct?

Off the top of my head, I really don’t know whether that is true or not.

There are different ways to break down income, but some of the standard are by individual, family, and household.  If you take a look at the median (middle) value, the median individual income is about $26,500 and the average income is closer to $40,000.  The average is greater than the median because people with high salaries drag the distribution out to the right.

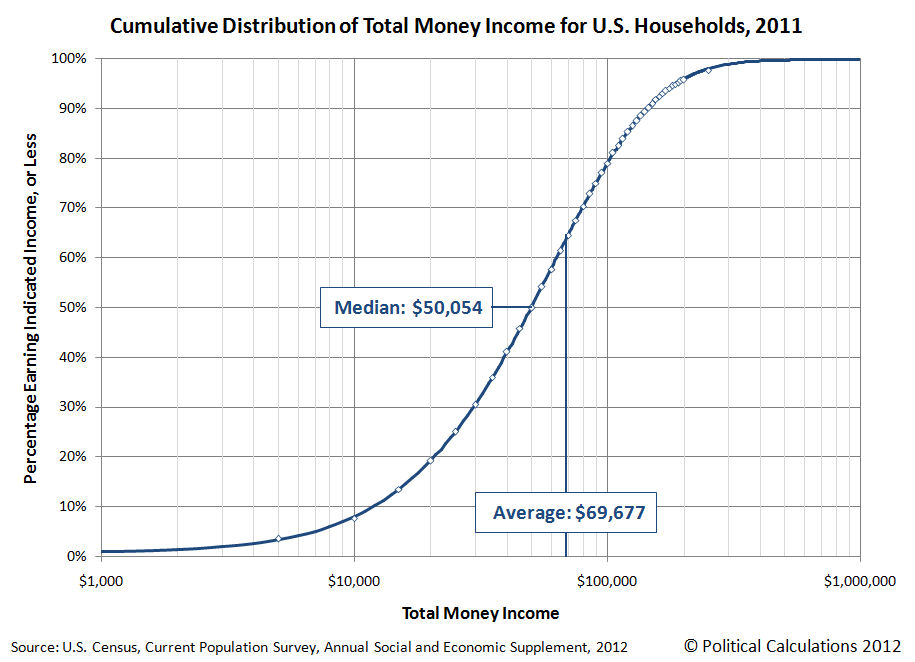
At the household level, the median household is about $50,000 per year, again indicating that half of all households make more and half less than that.  So Romney’s definition of middle class includes people making four to five times as much as the median family.

This gives us some perspective on things, but taking a look at central tendencies — medians and averages — only gets you so far.

So, fortunately for us, the good people at the Political Calculations blog have given us a web tool to see exactly who stands where. Taking a look at household incomes on the right, we can get a very good idea where the “middle class” is.  For example, if we define the middle class as the 20th to 80th percentile households, then the middle-class income is in the $20,700 to $102,500 range. You can pull this figure for yourself from the graph to your right.  Start at 20% and follow it across to the distribution, and then go down to see the total money income.

As you probably know, $200,000 is a fair bit of money.  A household with that level of income is in the 96th percentile, not quite high enough to qualify for the top 1% and the scorn and indignation of the Occupy movement, but still a good living.  Incidentally, it requires $305,000 to get into the top 1% if that’s of interest to you.

Be sure to write when you get there.

The little tool will be very helpful as we march toward the election, but it will also help us to frame where we put our sympathies (if anywhere) in any number of labor disputes. For example, here’s Tuesday Morning Quarterback Gregg Easterbrook on some labor disputes affecting professional sports:

The NFL Referees Association is angry about an NFL offer that would raise officiating salaries to an average of $189,000 annually for part-time work. The NHL union is angry about an offer that would reduce the current player average of $2.4 million to a mere $2 million annually.

Yes, many NFL and NHL owners are ogres, and none should receive public subsidies. But the framing of the disputes — unions claiming to be working-class victims versus plutocrats — is 50 years out of date. A hobby that pays $189,000 a year; a child’s game that pays $2 million a year plus leads to celebrity. The people offered these deals are angry and feel ill-used?

You can see where Easterbrook comes down here, and plugging the$189,000 into our tool shows that the NFL referee will be making more money than 98.7% of all individuals and 95% of all households nationally. My son also runs around in his pajamas blowing a whistle on Sundays, but he is not compensated quite so handsomely.

Of course, athletes aren’t the only ones with a beef.  Chicago public school teachers have been on strike for more than a week now, probably more over evaluation than over pay, but their salaries seem to stack up pretty favorably with their peers across the country.  Here are some of the parameters of the contract under negotiation:

In Chicago, the starting salary is roughly $49,000, and average salary is around $76,000 a year.The tentative contract calls for a 3 percent raise in its first year and 2 percent for two years after that, along with increases for experienced teachers. While many teachers are upset it did not restore a 4 percent pay raise Emanuel rescinded earlier this year, the contract if adopted would keep Chicago teachers among the highest-paid in the country.

The average salary puts the teacher in the 68th percentile, and two “average” teachers earning $152,000 per year would be in the top 10% of all households nationally.

Closer to home, our own Lawrence website boasts that “Lawrence grads earn the highest mid-career salary of any Wisconsin college,” with median starting salaries of $39,700 and mid-career salaries of $89,700.  The starting salary puts our median graduate ahead of two-thirds of the population and ahead of 40% of all households.

Riesgo Moral

In our continuing series on how incentives shape behavior, we take a look across the sea to España, where a man tragically sawed off his arm to collect on eight insurance policies.  It seems that insurance fraud is on the rise in the depressed economies of Europe

According to data from the ICEA, which carries out research for insurance and pension providers, there were 54,114 fraudulent claims in 2003; in 2011, there were 130,959.

We, of course, have seen this sort of thing before.  And even before that.

But it turns out that it is not only the depressed economies of Europe that are seeing a rise in fraud.  Right here in the U.S. it appears that there is a rather substantial rise in Social Security Disability Insurance claims.  I had first heard about this on an EconTalk episode featuring David Autor.

Craig “Ironman” Eyermann at the Political Calculations blog has the numbers here and further elaboration here.


Courses for Fall 2012

Welcome back to the friendly confines of LU.  Here are the Econ Department courses for the fall term:

ECON 120 INTRODUCTION TO MACROECONOMICS 12:30-01:40 MWF BRIG 224 03:10-04:20 R BRIG 224 Mr. Georgiou 

A study of the principles, concepts, and methods of economic analysis, with a theoretical focus on the determination of national income. Special attention given to governmental expenditure and taxation, monetary policy, inflation, and unemployment. Especially appropriate for those who only want to take one economics course. 

ECON 200 ECONOMIC DEVELOPMENT (G,W)  12:30-02:20 TR BRIG 223 Mr. Finkler 

This course seeks to provide students with a broad based understanding of economic development and the choices countries face. To obtain such an understanding, students will read the works of contemporary economists who provide a variety of approaches to poverty alleviation and the tradeoffs that must be confronted. Emphasis will be placed on close reading, class discussion, and on writing a number of papers that compare and contrast different views of economic development.

ECON 211 IN PURSUIT OF INNOVATION (S) 11:10-12:20 MWF BRIG 223  Mr. Galambos, Mr. Brandenberger, Mr. Vaughan 

This course acquaints students with innovation—its objectives, major characteristics, and likely origins. The course focuses mainly on scientific and /or technological innovation; it will be taught as a joint physics/economics offering. The course includes one or two lectures per week along with student presentations and hard-charging discussion based on readings from books, articles and case studies. Outside resource individuals (in most cases Lawrence alumni) who are well-placed and experienced in innovation will offer advice and guidance to particular student projects. Do yourself a favor and take this course. 

ECON 300 MICROECONOMIC THEORY (Q) 08:30-09:40 MWF BRIG 223 08:30-09:40 R BRIG 223 Mr. Galambos 

A study of the microeconomic foundations of economics. The course focuses on equilibrium models for consumers and firms in competitive markets, as well as deviations from perfect competition. Your first genuine step toward self-actualization.

ECON 430 CAPITAL AND GROWTH (Q) 09:00-10:50 TR BRIG 217 Mr. Finkler  

An examination of the determinants of long-term economic growth and productivity. Particular attention given to the role of capital, international competitiveness, savings, tangible investment, and the role of public policy in all such areas.

ECON 495 TOP: LAW AND ECONOMICS 03:10-04:20 MWF BRIG 217 Mr. Georgiou 

Along with an introduction to legal analysis, a study of the political economy of four core areas of the law: property, contracts, torts, and crime and punishment. Applies rational-choice theories to both economic and political decisions involving the law. 

Income Deciles Through the Years

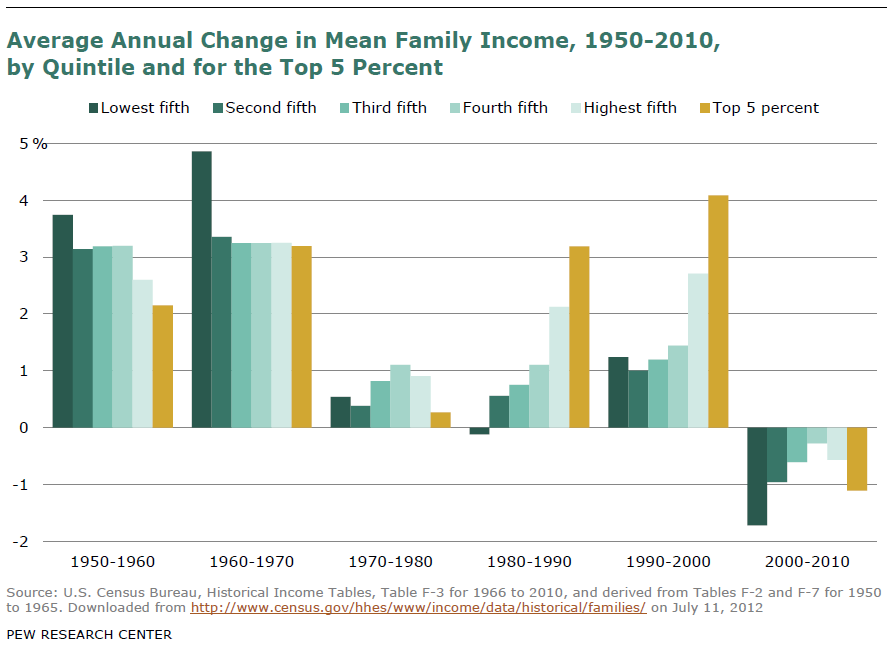
Jordan Weissmann at The Atlantic points us to a noteworthy breakdown of income changes through the years.


The Rich Get Poorer, The Poor Get Poorer


This tells a pretty interesting story. Coming out of World War II, the gains in the bottom decile are pretty solid up until the 1970s, when they seem to stagnate along with all other income groups.  It isn’t until the  1980s and 1990s that the top income bracket really takes off.

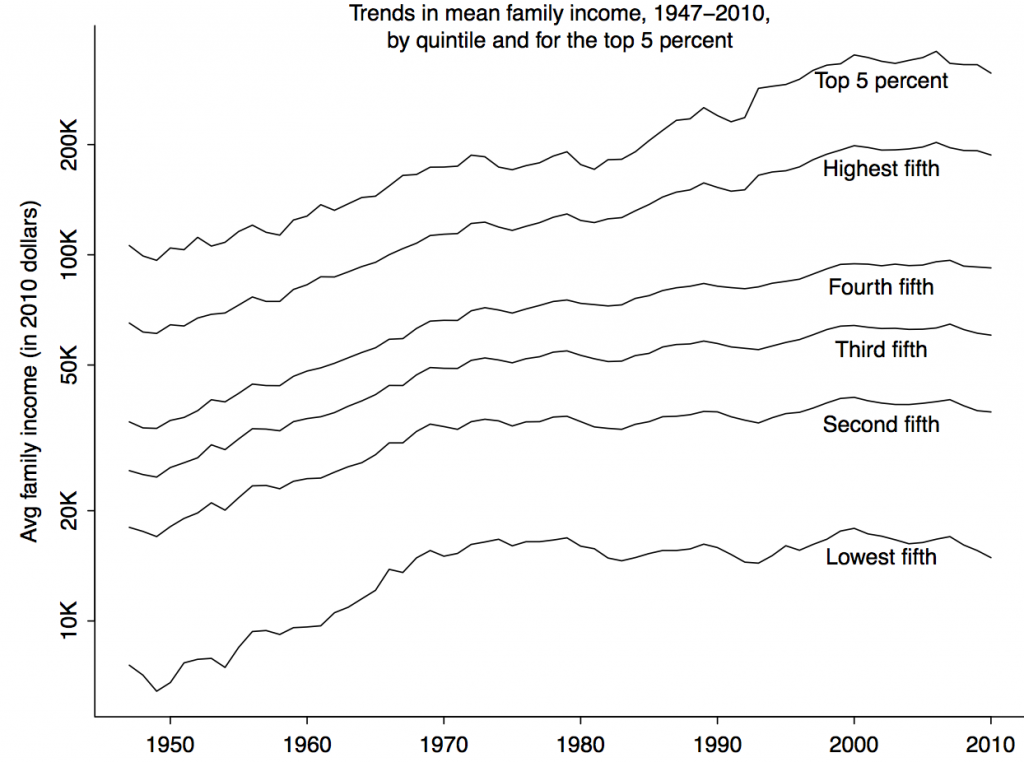
There are, of course, dozens of caveats with data like these.  But those aside, data guru Andrew Gelman simply doesn’t like this plot, so he takes some pains to make this clearer.  Here’s Gelman’s discussion, and below you can see roughly the same data in a more conventional time series format.


As Gelman correctly points out, his full series tells a different story. In particular, the sharp income decrease of the last decade occurred principally since 2007.  Yikes.

Gelman is great with data.  If you are interested in empirical social sciences, I recommend you check him out at The Monkey Cage or at his blog, or one of his many excellent books.

A Gold Rush of Commentary

It seems the Republican party’s talk of a gold commission has led to a virtual gold rush of commentary from columnists, talking heads, and assorted punditry.  Taking a glance at the Real Clear Markets link aggregator, I see “The Failing Case for Gold,” “The Top Ten Reasons you Should Support the Gold Commission,” and “GOP’s Golden Oldie,” along with the fabulously titled “The Lost Bush/Obama Era Gave Us the Gold Commission” and “The First Gold Commission Scared the Hell Out of the Fed. These latter two pieces with the provocative names are pretty favorable takes, I’d say.

Not every economist is high on the gold standard, as Paul Krugman noted a few years back:

There is a case to be made for a return to the gold standard. It is not a very good case, and most sensible economists reject it, but the idea is not completely crazy.

Most sensible economists, yes, suggesting that some sensible economists might be somewhat more favorable (see the links herein, for instance).

Of course, times change, and evidently so has Krugman’s assessment.  Here’s Krugman’s in yesterday’s New York Times:

The truth is that returning to gold is an almost comically (and cosmically) bad idea.

So much for the sensible goldbug.  Krugman finishes the piece with this zinger:

Now, the gold bugs will no doubt reply that under a gold standard big bubbles couldn’t happen, and therefore there wouldn’t be major financial crises. And it’s true: under the gold standard America had no major financial panics other than in 1873, 1884, 1890, 1893, 1907, 1930, 1931, 1932, and 1933.

I guess we’ll see how the campaign shapes up and perhaps we’ll be seeing more of this.

New(ish) Schumpeter Bio

For those of you who can’t get enough Schumpeter, Esben Sloth Andersen’s has a (somewhat) recent take in Joseph A. Schumpeter: A Theory of Social and Economic Evolution

Arthur Diamond has the review at the Economic History Association website, EH.net. Here’s an excerpt:

Andersen’s book invites comparison with business historian Thomas McCraw’s (2007) comprehensive intellectual biography.  McCraw’s book includes more new material and is written in a style that is more pleasant to digest.  Of greater importance is that McCraw gives more attention to Schumpeter’s best moves on innovation and creative destruction, and gives less attention to Schumpeter’s moves on evolutionary method and long wave theory.

Joseph A. Schumpeter is part of a series that aims to briefly present the main doctrines of important economists in the context of their lives and of events in the milieu in which they lived.  Andersen does include some chapters on Schumpeter’s life, but these usually read as obligatory afterthoughts, rather than as information integral to understanding Schumpeter’s doctrines.  And he does not seem to take as much care in this part as he does elsewhere, as, for example, when he opines without citation or much explanation that Schumpeter was “unbalanced” by the events leading up to World War II (p. 135).  The period is more fairly analyzed by McCraw who emphasizes that Schumpeter’s reasonable worries about Stalin’s Communism tempered his initial reaction to Hitler’s National Socialism.

Here is more on the author, Ebsen Andersen.  Here is more on the reviewer, Art Diamond.

GOP Going for the Gold?

Future Heads of the Hungarian Central Bank?

Speaking of gold, the Financial Times is reporting that the Republicans are discussing a return to the gold standard.

What do you suppose a return to the gold standard would entail?

I can’t answer that question in short order, but if you are interested, here are some places where I would start.

For a brief overview geared to a more general audience, Michael Bordo has a brief article and a number of references at The Concise Encyclopedia of Economics and Liberty.

For articles geared for more scholarly audiences, check out the article at the New Palgrave Dictionary of Economics (available from on-campus IP addresses), or a lengthier treatment, chocked full of descriptive statistics, is Lawrence Officer’s extensively documented piece at the Economic History Association’s webstite, EH.net.

Speaking of Gold

Jordan Weismann has an interesting bit in The Atlantic on the recent decline in gold prices — off about 15% from last-year’s peak — that includes some fascinating perspective on China and the world economy:

[China] deregulated its gold market in 2001, and since then, it has gone from consuming about a third as much gold as the developed west to overtaking it by 2011. Let me repeat that: the Chinese buy more gold than the entire west combined.

The current gold price seems pretty high to me.  Back when I was thinking more about the mining industry, (nominal) prices were less than $400 /oz;  today’s prices are north of $1500.  So, even adjusting for inflation, that is a pretty good ride.  But when I looked for a graphic to illustrate the changes, I came across this nice blog post on how it’s hard to find an “objective” series of real gold prices.

Gold markets are interesting for all sorts of reasons that I won’t get into here. Perhaps I will start cobbling together a reading list on the many dimensions of the economics of gold and gold markets.

Well, Just Wait Until the Winter Games

Some of you are aware that the summer Olympics have been taking place over the past few weeks, with athletes all around the world convening in London to kick each other, swim and dive in perfect synchronicity, throw balls into nets, and perform other feats of strength. As a way of monitoring each country’s progress, it is customary for the IOC and the media to keep a tally of how many medals each country has accumulated and then talking about it as if it had some great import. This year the United States amassed a whopping 104 total medals, with the People’s Republic of China coming in a distant second with 88 and Great Britain with a mere 65.

That metric never seemed quite right to me, though, because many events seem kind of like made up sports, and others involve teams, yet the team victory seems to just count as one medal.

Those issues aside, there is also the more fundamental issue that a country like, say, Grenada doesn’t have very many people in it.  Indeed, it might be the case that the Chinese sent more athletes to London than the entire population of Grenada combined. Yet, Grenada and China are set on equal footing in the ubiquitous Medal Count competition.

That’s why we’re fortunate to have Medals Per Capita dot Com keeping it real for us. The site does what you’d expect, adjusting the medals count based on population to produce the coveted “population per medals” metric.

And, on that score, the rankings change dramatically.  Indeed, tiny Grenada, with only 110,821 people, leads the way with one medal and a population per medal score of 110,821.   This bests second-place Jamacia’s score of 225,485 by a lot.  But Jamacia did come in with an astonishing 12 medals despite having a population slightly larger than the Pittsburgh metro area. Trinidad and Tobago and the Bahamas are also among the top five.

I should also mention — before somebody does it for me — that Hungary is an impressive 8th with 17 medals for a population of 10 million, which is about one medal per 600,000 inhabitants.

What about the “medals count winners”?  Well, the mighty US with its 104 medals is only about one medal per three million people, good for a measly 49th place, while China is way down in 74th on a per capita basis, with only a medal per 15 million people.

So, to put things in perspective, a simple linear extrapolation suggests that if Grenada had China’s population, it would have amassed more than 12,000 medals. In contrast, with 84 medals per 1.3 billion people, if China had Grenada’s population, it would have netted only 0.0068 medals.

On the one hand, this illustrates why it is probably a good idea not to put too much stock in linear extrapolations, but on the other hand, these types of comparisons are important, as any sort of comparative analysis needs to have some reasonable baseline or measure of perspective.

The Medals per Capita dot Com page has a whole menu of metrics for you to play with, so with the fall term at least a week away, go ahead and start playing.

Prediction Markets v. Polls, Cont.

This coming Tuesday in Wisconsin is the Republican Senate primary to replace retiring Senator Herb Kohl.  The race is quite hotly contested by former governor Tommy Thompson, Madison banker Eric Hovde, and former state representative Mark Neumann.

The latest poll is out, with Thompson enjoying a rather chunky lead at 28% to Hovde’s 20% and Neumann’s 18%.

As of 6 p.m. today, however, InTrade tells a much different story. And that story is that Hovde is up (a 40% chance of winning), followed by Neumann (35%) and then Thompson (32%). Huh.

So, who are you going to believe?

A couple of things to notice here.  First, yes, I know the InTrade odds add up to more than 100%.  Second, earlier this week, InTrade had Hovde with a commanding lead of 70% or so.  Oh, and a third thing, Tommy Thompson can do more pushups than any of the junior professors in the department.

More on this later.

UPDATE:  The prediction market now has Thompson as the odds-on favorite.

A Second Update: Thompson wins.